Technicals

Add as a preferred source on Google

US oil downside capped by 200- day MA, jump till $60 likely

Ichimoku Analysis (Daily chart) Tenken-Sen - $61.78 Kijun-Sen- $61.67 US Oil recovered slightly after the decline of more than 10% from temporary top $65.72 formed on Jan 8th, 2020. The jump mainly came on US-Iran geopol…

Updated 1 min read
US oil downside capped by 200- day MA, jump till $60 likely
Image from the original EconoTimes article

Read the original article

Ichimoku Analysis (Daily chart)

Tenken-Sen - $61.78

Kijun-Sen- $61.67

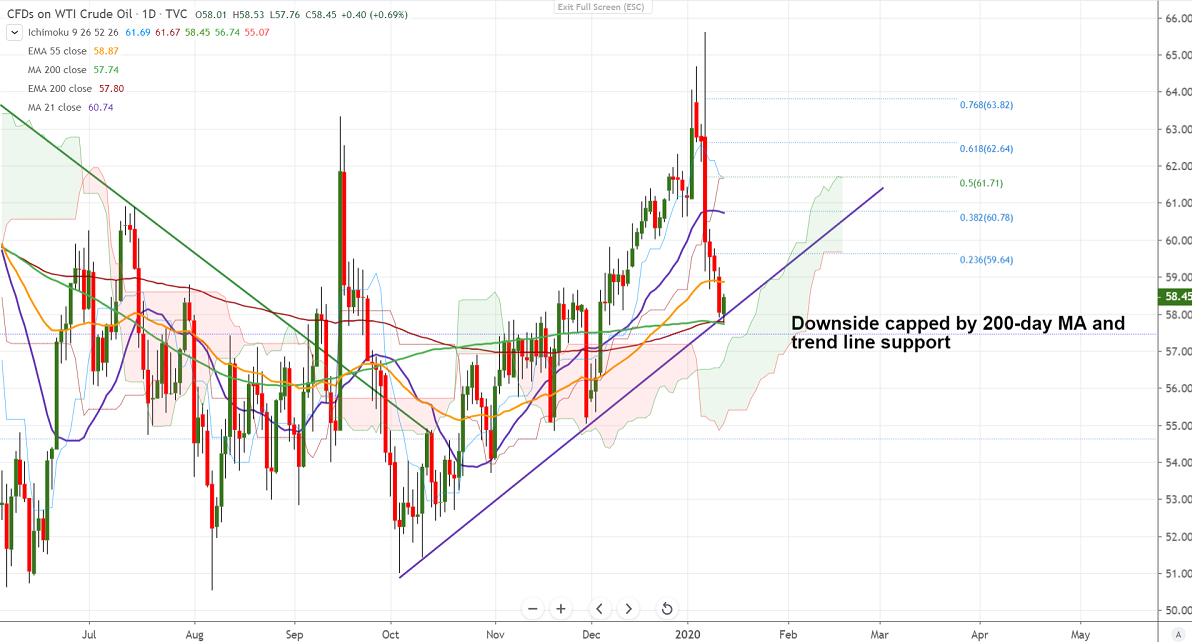
US Oil recovered slightly after the decline of more than 10% from temporary top $65.72 formed on Jan 8th, 2020. The jump mainly came on US-Iran geopolitical escalation but slight easing has dragged the oil prices sharply till $57.76. It is currently trading around $58.45.

On the flip side, oil has taken support near 200-day MA and shown a minor recovery of $58.53 level. Any major weakness can be seen if it closes below $57.75, a dip till $55 possible.

The near term resistance is around $58.89 (55- day EMA) and any violation above will take the oil to the next level till $59.25/$60.

It is good to buy on dips around $58.25-30 with SL around $57.75 for the TP of $60.

Related articles

View all
Technicals

Major Pair Currency Score: AUDUSD Bearish

EURUSD - Levels to watch - 1.100 GBPUSD Levels to watch - 1.3180 USDCHF Levels to watch - 0.8400 USDCAD - Levels to watch - 1.4300 AUDUSD - Levels to watch - 0.7000 NZDUSD - Levels to watch - 0.5560

