


 FxWirePro: GBP/AUD bears maintain upper hand
  FxWirePro: GBP/NZD remains weak, eyes 38.2%fib support
  FxWirePro: GBP/USD rises as soft US data pressures dollar
  AUDJPY Volatile After Massive Sell-Off: Sell Rallies at 113, Targeting 110 as Bearish Momentum Surges
  FxWirePro:USD/JPY climbs back above 160.00 after BOJ rate decision
  FxWirePro: USD/CNY dips to hit three year low,scope for further downside
  AUD/JPY Slips Below 112 as BOJ Intervention Sparks Bearish Momentum: Sell the Rallies
  FxWirePro- Major Pair levels and bias summary
  FxWirePro- Major Crypto levels and bias summary
  FxWirePro- Woodies pivot (Major)
  FxWirePro: USD/CAD retreats after Canada posts stronger-than-expected GDP growth
  FxWirePro: GBP/NZD remains weak, eyes 38.2%fib support
  FxWirePro- Major Pair levels and bias summary
  FxWirePro: NZD/USD consolidates overnight gains, but loses momentum
  Major FX Action Bias & US Market Sentiment: NZD/USD (Extremely Bullish) & AUD/USD (Bullish) Watchlist


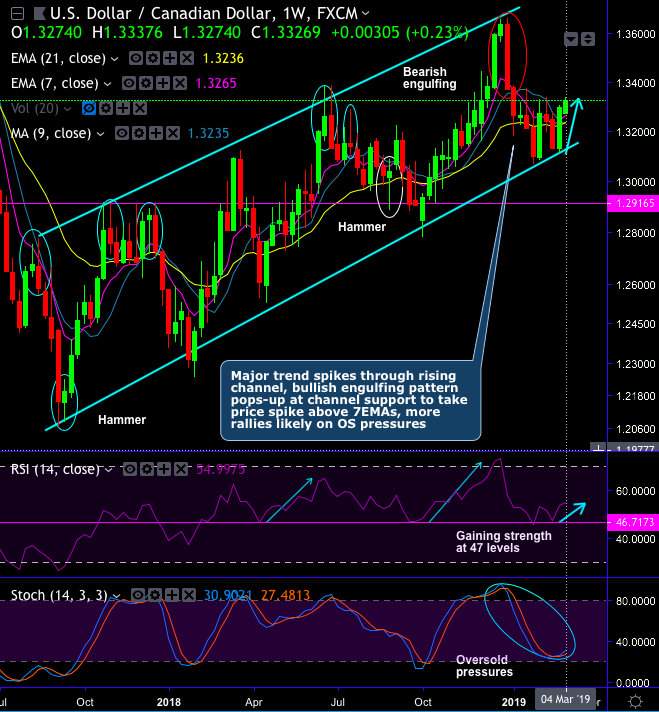
Technical Chart and Candlestick Patterns: USDCAD has shown its bearish effects as stated in our previous posts upon the formations of hanging man and bearish engulfing candles at 1.3637 and 1.3370 respectively. Consequently, these bearish patterns are coupled with 3-black crow patterns at 1.3297 level has plummeted the prices convincingly (refer daily chart).
But on the contrary for now, we, now, trace out bullish engulfing candles at 1.3296 levels (on both weekly daily terms) that has also signaled strength in rallies of this pair.
Most importantly, these bullish patterns have developed double bottom and ascending channel patterns. The pair has formed bottom 1 at 1.3068 and bottom 2 at 1.3112 levels, consequently, the current price has spiked well above DMAs with bullish crossovers.
While both leading oscillators (RSI and Stochastic curves) show upward convergence to indicate the strength in the uptrend and the intensified buying momentum.
To substantiate this buying sentiment, MACD’s bullish crossover also indicates upswings to prolong further.
On a broader perspective, the bullish engulfing candle has occurred exactly at channel support at 1.3296 levels, ever since then bulls managed to nudge prices above EMAs from last three-four weeks.
As a result, the major uptrend is most likely to prolong further in the ascending channel (refer weekly plotting).
Trade Tips: One daily trading grounds, at spot reference: 1.3325 levels, we advocate executing double touch call options strategy with a view of participating in prevailing rallies, use upper strikes at 1.3340 levels, that means the strategy for 15 pips is likely to fetch leveraged yields as long as the underlying price keeps spiking towards upper strikes on the expiration.
Alternatively, contemplating above technical rationale, we advocated initiating longs in EURCAD futures contracts of Mar’19 delivery for the major uptrend. We continue to uphold the same strategy by rolling over.
Currency Strength Index: FxWirePro's hourly CAD spot index is flashing at 50 (which is bullish), while hourly CAD spot index was at -111 (highly bearish) while articulating at 06:03 GMT. These indices are conducive for above strategy ahead of BoC monetary policy this week.
For more details on the index, please refer below weblink: http://www.fxwirepro.com/currencyindex


