


 US Magnificent 7 Stocks Trend Score: Amazon & Microsoft Hit Extreme Bullish (+100) as Meta Drops to -100 — Key Resistance & Support Watchlist
  FxWirePro- Woodies pivot (Major)
  JPY Currency Meter Signals: NZDJPY Bullish (+25) vs CHFJPY (-100) – These Pairs Could Move Next
  FxWirePro- Woodies pivot (Major)
  FxWirePro: GBP/USD rises as soft US data pressures dollar
  NZDJPY Retreats on Yen Strength – Bearish Setup Targets 90 After Hitting 92.75 Low
  US Magnificent 7 Stocks Trend Score: Amazon & Microsoft Hit Extreme Bullish (+100) as Meta Drops to -100 — Key Resistance & Support Watchlist
  AUD/JPY Slips Below 112 as BOJ Intervention Sparks Bearish Momentum: Sell the Rallies
  Nikkei Surges Past 65,000 on Suspected Yen Weakness: Tech Giants Like Advantest and NEC Lead Explosive Gains
  AUDJPY Volatile After Massive Sell-Off: Sell Rallies at 113, Targeting 110 as Bearish Momentum Surges
  FxWirePro: USD/CAD retreats after Canada posts stronger-than-expected GDP growth
  FxWirePro- Major Crypto levels and bias summary
  FxWirePro: USD/CNY dips to hit three year low,scope for further downside
  FxWirePro- Major Pair levels and bias summary
  FxWirePro: GBP/AUD bears maintain upper hand
  FxWirePro: USD/ZAR gains as stronger dollar outweighs upbeat South Africa's trade surplus


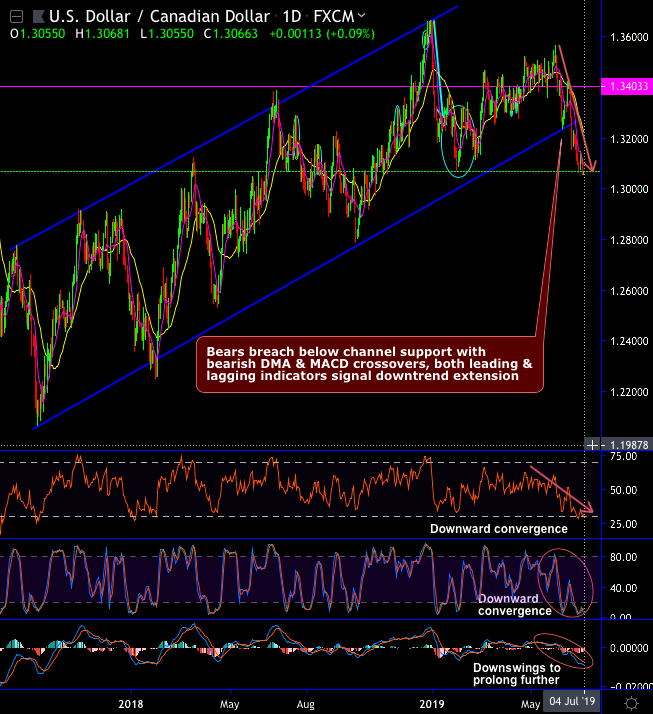
Technical Chart and Candlestick Patterns: USDCAD minor trend has developed ascending channel pattern. The pair has tested channel support several times in the recent past, consequently, spiked well above EMAs.
But for now, bears managed to breach below channel support with bearish DMA & MACD crossovers as you can observe daily plotting, while both leading and lagging indicators signal downtrend extension.
Both RSI and Stochastic curves show downward convergence to these price dips to indicate the strength and the intensified selling momentum in the minor bearish trend.
To substantiate this selling sentiment, bearish DMA & MACD crossovers also indicate the downswings to prolong further.
On the flip side, the major uptrend goes through uptrend line (refer monthly chart), the current price hovers around 21-EMAs as both momentum & trend indicators edgy but still in bulls' favor.
Hence, the prevailing uptrend is most likely to prolong further if it holds the support of the uptrend line and 21-EMAs.
Trade tips: On hedging grounds, at spot reference: 1.3065 levels, contemplating above technical factors, we advocate initiating shorts in USDCAD futures contracts of near month tenors (i.e. July’19 delivery) as further downside risks are foreseen and simultaneously, longs in futures of August’19 delivery not disregarding the major uptrend amid the prevailing global geopolitical risks. Thereby, one can directionally position in their FX exposures. The directional implementation of the same trading theme by further allow for a correlation-induced discount in the options trading also if you choose strikes appropriately.
Currency Strength Index: FxWirePro's hourly CAD spot index is flashing at -81 (which is highly bearish), while hourly USD spot index was at -25 (mildly bearish) while articulating at 05:40 GMT.
For more details on the index, please refer below weblink: http://www.fxwirepro.com/currencyindex


