


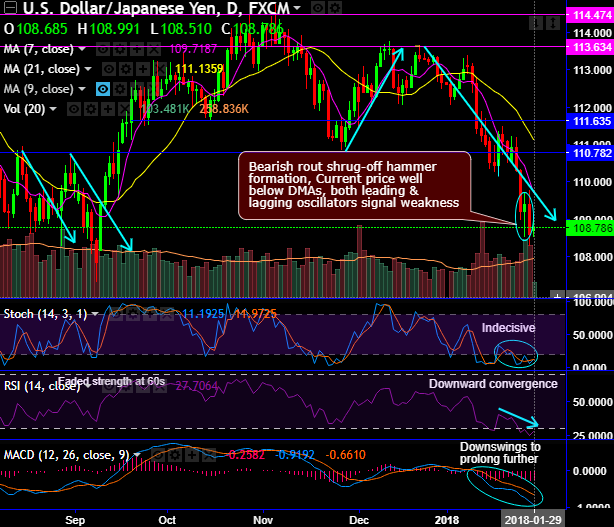
Chart and candlestick patterns: USDJPY forms long lasting range on weekly as well as on monthly plotting. Hammer pattern candle occurs on daily terms which is bullish in nature. Bearish rout shrug-off this bullish pattern. Bearish engulfing candle occurs on monthly terms. As a result, the current price is still well below DMAs, while both leading & lagging oscillators signal weakness.
Observe current downswings slid below DMAs with the bearish momentum that indicates more slumps seem to be on cards.
The stiff resistance zone, for now, is observed at 110.782 to 111.635 areas, we’ve seen the failure swings at this juncture couple of times in the recent past.
Both RSI & stochastic curves are converging downwards to signal the strength and intensified bearish momentum on daily terms and same has been the case on monthly terms as well.
While the trend indicators also signal weakness to prevail, 7EMA crosses below 21EMA which is the bearish crossover on monthly terms indicate the downtrend to prolong further in the weeks to come.
MACD also indicates downswings to prolong further in both short and medium terms.
Well, overall, one could trust the indications given by the leading & lagging indicators on daily terms coupled with bearish candlestick formation and bid for further dips upto next strong supports at 107.272 levels.
While the major trend still stuck between 23.6% and 38.2% Fibonacci retracement levels (refer weekly plotting), the trend on this timeframe shows failure swings exactly at 23.6% Fibonacci levels several times in the recent past. On the flip side, it has tested strong supports at or around 38.2% levels. In this oscillating price behavior, the pair is stuck in the long-lasting range.
Trading tips: Contemplating above technical rationale, we advocate buying tunnel spreads to participate in the ongoing bearish sentiments, use upper strikes at 109.969 and lower strikes at 108.430. This strategy is likely to add magnifying effects to the yields as spot FX keeps dipping until expiration but remain above lower strikes.
Since bearish momentum in major trend are intensified, at spot reference: 108.818, contemplating lingering bearish indications, on hedging grounds we’ve already recommended shorting near-month month futures as the underlying spot FX likely to target southwards 107 levels in the medium run. Hence, uphold the shorts in near month tenors.
Writers in a futures contract are expected to maintain margins in order to open and maintain a short futures position.
Currency Strength Index: FxWirePro's hourly USD spot index has shown -7 (which is neutral), while hourly JPY spot index was at 44 (highly bullish) while articulating at 06:36 GMT. For more details on the index, please refer below weblink:
http://www.fxwirepro.com/currencyindex.
FxWirePro launches Absolute Return Managed Program. For more details, visit:


