


Refer USD/JPY chart on Trading View
- USD/JPY is extending upside for the 2nd straight session, trades 0.26% higher on the day.
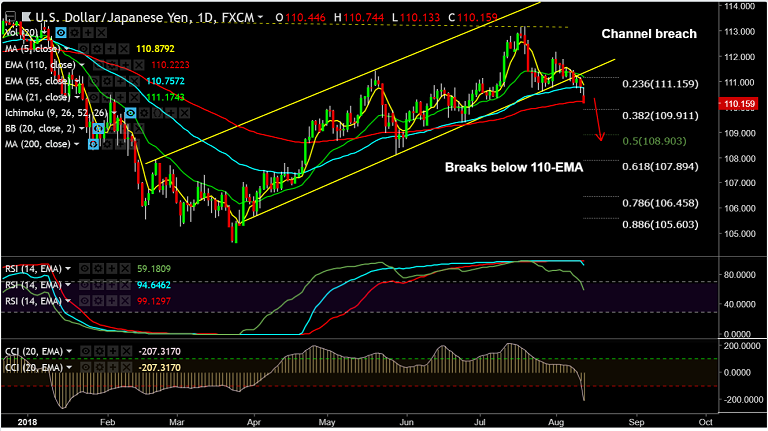
- The pair has bounced of 110-EMA support on the daily charts and has broken above 55-EMA.
- Channel breach keeps scope for downside, but technical indicators on the daily charts still point to higher bias. We do not see any major signs of reversal.
- Price action finds stiff resistance at 21-EMA at 111.20, break above could see further upside.
- Retrace and close below 5-DMA will see drag till 110-EMA. Break below will see extension of downside.
Support levels - 110.91 (5-DMA), 110.24 (110-EMA), 109.91 (38.2% Fib & 200-DMA)
Resistance levels - 111.20 (21-EMA), 111.40 (channel base, May 21 high)
FxWirePro Currency Strength Index: FxWirePro's Hourly USD Spot Index was at 117.869 (Bullish), while Hourly JPY Spot Index was at 81.6686 (Neutral) at 0930 GMT. For more details on FxWirePro's Currency Strength Index, visit http://www.fxwirepro.com/currencyindex.


