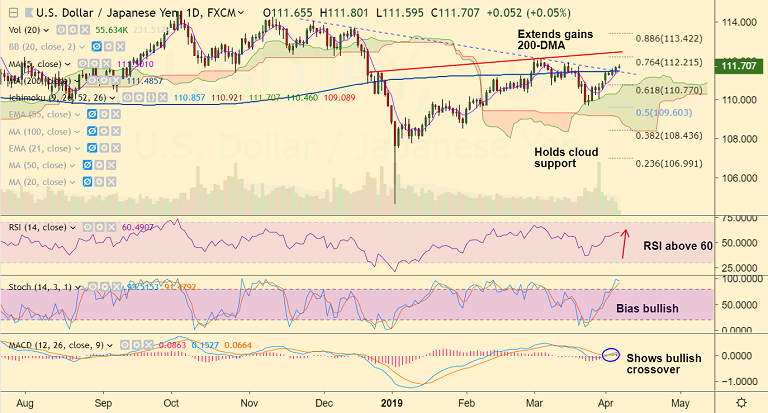
USD/JPY chart - Trading View
Technical Analysis: Bias Bullish
- Price action has broken above 200-DMA
- The pair is extending bounce off cloud support
- RSI is above 60 levels, Stochs show bullish momentum
- MACD shows bullish crossover on signal line
Data Watch:
- Japan’s February month leading economic index (expected to increase to 97.3 from 95.9)
- U.S. NFP (expected to recover after February month’s disappointing numbers, headline likely to rise to 180K from 20K)
Events Watch:
- Developments surrounding the risk events like the US-China trade deal and Brexit (US lawmakers’ claim that they are moving well on the trade deal with China and expect the results soon)
Support levels - 111.48 (converged 5 and 200 DMAs), 110.91 (55-EMA), 110.77 (61.8% Fib)
Resistance levels - 112, 112.21 (76.4% Fib), 112.45 (trendline)
Currency Forecast: Scope for test of 112 levels. Further upside could see 112.21 (76.4% Fib) and 112.45 (trendline).
For details on FxWirePro's Currency Strength Index, visit http://www.fxwirepro.com/currencyindex.