


 EUR/JPY Holds Bullish Bias as Euro Extends Recovery
  FxWirePro: EUR/AUD outlook weaker on renewed downside pressure
  FxWirePro- Major Pair levels and bias summary
  FxWirePro: NZD/USD edges lower, remains on back foot
  FxWirePro: GBP/USD edges higher as traders await BoE guidance and UK fiscal clarity
  FxWirePro- Major Crypto levels and bias summary
  FxWirePro: USD/ZAR uptrend loses steam, remains on bullish path
  FxWirePro- Woodies pivot (Major)
  FxWirePro: GBP/AUD downside pressure builds, key support level in focus
  FxWirePro: AUD/USD dips after RBA Governor speech
  EUR/USD Bounces from Monthly Low, But Bearish Pressure Remains
  NZDJPY Pullback: Sell Rallies Toward 93.30 as Yen Weakness Eases
  FxWirePro- Woodies pivot (Major)
  FxWirePro- Major Pair levels and bias summary
  FxWirePro: GBP/NZD gains some ground but bias is still bearish
  AUDJPY Weakness Deepens: Sell Rallies Toward 112 as Aussie Dollar Falters
  FxWirePro: EUR/NZD up trend gains momentum but hurdles ahead


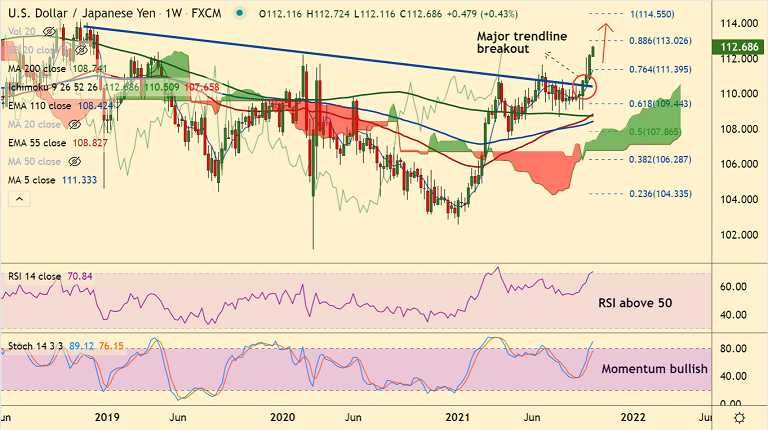
USD/JPY chart - Trading View
Spot Analysis:
USD/JPY was trading 0.44% higher on the day at 112.69 at around 05:45 GMT
Previous Week's High/ Low: 112.25/ 110.82
Previous Session's High/ Low: 112.25/ 111.51
Fundamental Overview:
USD/JPY hit new multi-month high versus the yen as the pair extend bull run for the 3rd straight month.
Disappointing figures from the latest U.S. NFP report did not alter market expectations regarding the U.S. Federal Reserve's asset tapering plans.
The U.S. jobs report Friday disappointed market expectations with non-farm payrolls at 194,000 and the unemployment rate at 4.8% in September.
Despite a weak headline payroll figure, the outlook remains solid. With labor shortages still a possibility and fanning inflation concerns, the Fed is likely to begin asset tapering as soon as November 2021.
Focus now on the consumer price index (due Wednesday). Upbeat data could stoke expectations of an earlier interest rate hike and bring further gains for the USD.
Technical Analysis:
- USD/JPY extends bullish streak for the 6th straight week
- Channel breakout on the daily charts adds to the bullish bias
- Momentum is strongly bullish, volatility is high and rising
- MACD, ADX and the GMMA indicator support further gains
Major Support and Resistance Levels:
Support - 112 (psychological mark and channel top), Resistance - 113.02 (88.6% Fib)
Summary: USD/JPY trades with a bullish bias. Scope for test of 113 mark.


