


 FxWirePro: AUD/USD gains on Iran-US truce hopes, risk rally
  FxWirePro: USD/CAD gaining momentum for a move towards 1.4200 level
  FxWirePro: AUD/USD dips after RBA Governor speech
  FxWirePro: GBP/USD downtrend loses steam but outlook still bearish
  AUDJPY Action Bias: Bullish Dip-Buy Setup Despite Flat Neutral Bias
  FxWirePro: NZD/USD edges lower, remains on back foot
  FxWirePro- Woodies pivot (Major)
  FxWirePro: GBP/AUD downside pressure builds, key support level in focus
  FxWirePro- Major Pair levels and bias summary
  FxWirePro- Major Crypto levels and bias summary
  FxWirePro- Major Crypto levels and bias summary
  FxWirePro: NZD/USD gains as U.S.-Iran peace hopes boost risk sentiment
  FxWirePro: USD/CAD positions for another climb, eyes 1.4150 level
  FxWirePro: GBP/NZD downside pressure builds, key support levels in focus
  FxWirePro: USD/ZAR uptrend loses steam, remains on bullish path
  JPY Action Bias: Bullish Pairs to Watch Out For


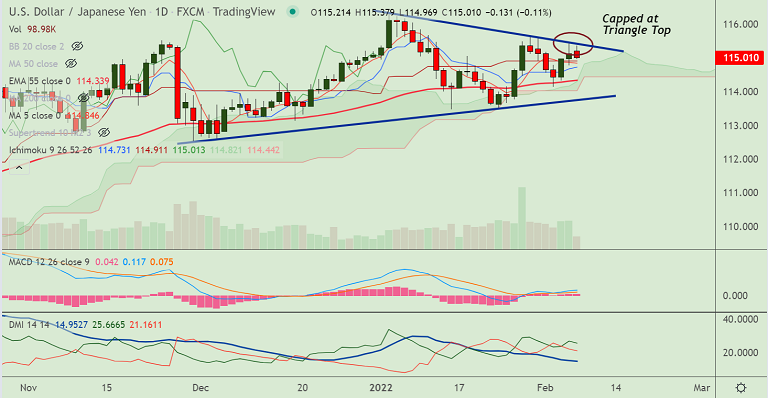
Chart - Courtesy Trading View
USD/JPY was trading 0.12% lower on the day at 115.00 at around 11:15 GMT.
US dollar is struggling to extend NFP-led rally, snaps a 2-day upside.
The major is extending trade in a Symmetric Triangle pattern and upside was rejected at Triangle top resistance.
GMMA indicator shows major and minor trend in the pair are bullish on the daily charts.
Price action is currently holding above 200H MA support at 114.93. Break below could see more weakness.
Technical indicators are inconclusive. 5-DMA is immediate support at 114.84 ahead of 21-EMA at 114.72.
Bearish RSI divergence on the weekly charts adds to the downside bias. Break below 55-EMA (114.33) will change near-term dynamics.


