


 FxWirePro: USD/CAD slips after Fed holds rates steady
  FxWirePro: GBP/USD edges lower ahead of Fed policy verdict
  FxWirePro- Major Pair levels and bias summary
  NZDJPY Bullish Rebound: Buy Dips as EMAs Align for 97 Target
  Buy the Dips on EUR/JPY: Bullish Structure Points to 188 Target Ahead of Fed
  FxWirePro: USD/JPY edges higher as focus shifts to BOJ decision
  FxWirePro: USD/ CNY remains soft ahead of Fed decision
  FxWirePro- Woodies pivot (Major)
  FxWirePro: EUR/ AUD gains some ground , but remains on bearish path
  NZD/JPY Flatlines Near 94.60: Will Key Support Reignite the Uptrend?
  JPY Action Bias: EURJPY and CADJPY Emerge as Extremely Bullish Pairs to Watch
  FxWirePro: NZD/USD firms as Kiwi gains on strong ANZ business outlook data
  Major Forex Pairs Action Bias: GBPUSD and AUDUSD Turn Extremely Bearish
  FxWirePro: USD/JPY eases ahead of Fed decision , Intervention risks linger
  JPY Pairs Action Bias: EURJPY Leads as Bullish Standout Amid Mixed Momentum
  Major FX Action Bias & US Market Sentiment: NZD/USD (Extremely Bullish) & AUD/USD (Bullish) Watchlist


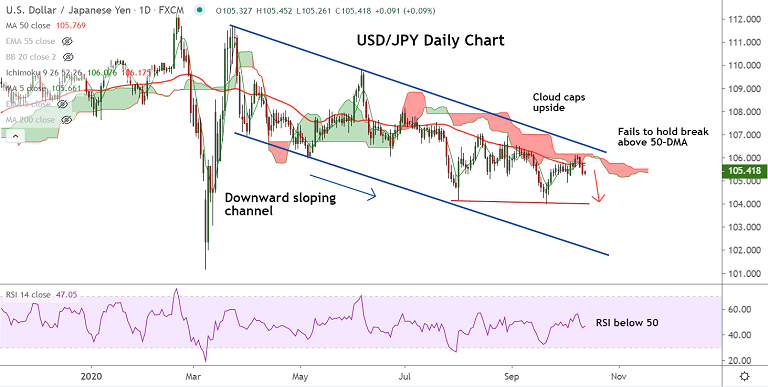
USD/JPY chart - Trading View
USD/JPY was trading 0.10% higher on the day at 105.42 as the pair snaps a 2-day losing streak.
However, upside looks limited as market remains risk averse amid coronavirus and U.S. stimulus woes and continuing US-China tussle.
On the data front, Japan’s September month Money Supply increased from 8.6% prior and 8.1% forecast to 9.0% MoM.
Further, China's Trade Balance for September in USD terms, showed a narrowing trade surplus, in light of a big jump in imports.
Data showed China's Trade Balance came in at +37B versus +59.98B expected and +58.9B previous.
Exports (YoY) stood at +9.9% vs. +10.0% expected and +9.5% last. While Imports (YoY) were at +13.2% vs. +0.2% expected and -2.1% last.
US 10-year Treasury yields fell two basis points (bps) to 0.75% supporting the U.S. dollar across the board.
Technical studies for the pair support weakness. Price has failed to extend break above 50-DMA.
Bearish 'Death Cross' formation on the hourly charts The pair is set to slide lower in a downward sloping channel.
Bearish potential remains intact. 20-DMA is immediate support at 105.35. Decisive close below will see drag lower.
Support levels - 105.29 (5W MA), 104.94 (Oct 2nd low), 104 (Sept 21 low)
Resistance levels - 105.66 (Nearly converged 200H MA and 5-DMA), 105.76 (50-DMA), 106


