


 Sell the Bounce": Gold Rally Stalls Near $4165 as Fed Hawks Slam the Door on Rate Cuts — Targets $4000/$3600
  China’s AI Manufacturing Boom Masks Weak Consumer Economy, Citi Says
  World Cup technology: from ref cams to AI analysts, cutting-edge research is changing the game
  How Donald Trump has changed the way diplomacy is done
  Trump’s Iran Strategy: What Has Been Achieved After Three Months of Conflict?
  SpaceX Stock Gets $175 Target as Analysts See Massive Growth Ahead
  Today’s space race could turn fatal if we don’t agree on new rules
  Bank Regulation Rollbacks in the U.S. and UK Could Increase Financial Risks, Study Warns
  Silver Cracks Key 365-Day EMA for First Time Since Feb 2024; Bears Eye $50 on Rallies
  Gold Surges Above Key EMAs, Bulls Eye Resistance Amidst Bullish Momentum
  J.P. Morgan Sees Potential Vestas Guidance Upgrade Amid Strong Wind Energy Demand


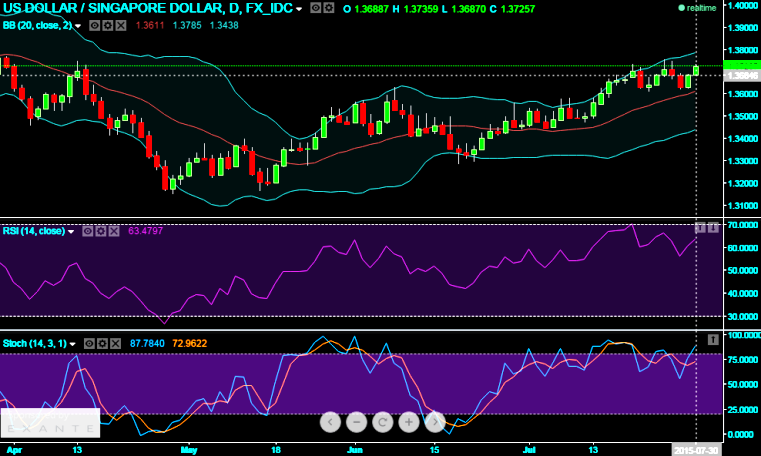
We've been reiterating that the prevailing uptrend for USD/SGD seems to be exhausted in an attempt to evidence 3 month's high but looking weaker as it was unable to sustain the same.
The leading oscillating indicator RSI (14) signals overbought scene as the RSI curve touches 70 levels which is overbought level, the price dips converges the strength index curve.
But on the contrary slow stochastic curve is currently signifying the buying interest back again as %K line crossover near 70 levels.
Since we anticipate the downtrend in this pair, the At-The-Money delta call of USD/SGD value indicates the option's equivalent position in the underlying market.
ATM calls might be luring for many speculators or hedgers at this moment.
Let's suppose for instance, as shown in the diagram USD/SGD ATM call option with Delta +0.5 can be delta hedged by selling 50,000 USD against SGD in the underlying FX market.

- News

- Economy

- Central Banks
- Investing
- Research
- Roundups
- Digital Currency
- Insights
- Technical Analysis
- Technology
- Business
- Law
- Health
- Nature
- Fintech
- Science
- Topic
- Opinions
- ©Econometrics LLC . All Rights Reserved.
FxWirePro: USD/SGD uptrend remains intact; delta hedge to confront puzzling swings
Thursday, July 30, 2015 8:28 AM UTC
Editor's Picks


- Market Data
Most Popular


