


 NZDJPY Retreats on Yen Strength – Bearish Setup Targets 90 After Hitting 92.75 Low
  FxWirePro: AUD/USD cedes early gains ,outlook bearish
  FxWirePro: USD/CNY downtrend loses steam, remains on bearish path
  FxWirePro: GBP/AUD bears maintain upper hand
  Major European Indices Score Extremely Bullish: DAX Eyes 26000, CAC Targets 8600, FTSE100 at 11000 – Key Levels to Watch
  FxWirePro- Major Pair levels and bias summary
  FxWirePro: NZD/USD consolidates overnight gains, but loses momentum
  AUDJPY Volatile After Massive Sell-Off: Sell Rallies at 113, Targeting 110 as Bearish Momentum Surges
  US Magnificent 7 Stocks Trend Score: Amazon & Microsoft Hit Extreme Bullish (+100) as Meta Drops to -100 — Key Resistance & Support Watchlist
  FxWirePro: AUD/USD gains some ground but outlook is bearish
  FxWirePro: USD/ZAR gains as stronger dollar outweighs upbeat South Africa's trade surplus
  FxWirePro: USD/JPY dips as market assess risk of additional FX intervention.
  FxWirePro: USD/CNY dips to hit three year low,scope for further downside
  FxWirePro: GBP/AUD drifts lower after BOE rate decision
  JPY Currency Meter Signals: NZDJPY Bullish (+25) vs CHFJPY (-100) – These Pairs Could Move Next


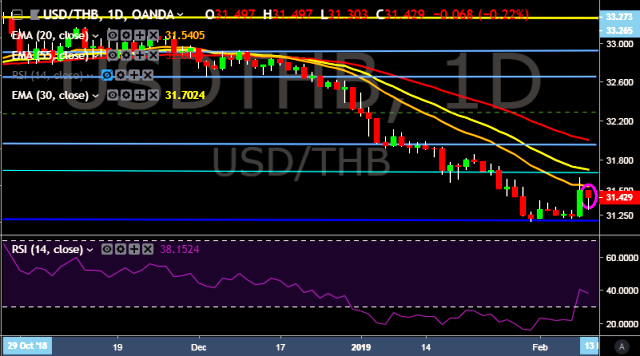
- USD/THB is currently trading around 31.43 marks.
- It made intraday high at 31.49 and low at 31.30 marks.
- Intraday bias remains bearish till the time pair holds key resistance at 31.62 mark.
- On the top side, key resistances are seen at 31.62, 31.70, 31.93, 32.02 and 32.10 marks respectively.
- Alternatively, a daily close below 31.49 will drag the parity down towards key supports around 31.30, 31.18, 31.10 and 30.94 marks respectively.
- Important to note here that 20D, 30D and 55D EMA heads down and confirms the bearish trend in a daily chart.
We prefer to take short position on USD/THB around 31.45, stop loss at 31.52 and target of 31.22 mark.


