


 FxWirePro: GBP/AUD drifts lower after BOE rate decision
  AUDJPY Bears Tighten Grip: Sell Rallies at 110.65-67 Targeting 107.75 as All EMAs Stay Red
  FxWirePro: USD/ZAR gains as stronger dollar outweighs upbeat South Africa's trade surplus
  FxWirePro- Major Crypto levels and bias summary
  FxWirePro: USD/CNY downtrend loses steam, remains on bearish path
  All Major JPY Pairs Hit Extreme Bearish Score of -100: USDJPY, EURJPY, GBPJPY, AUDJPY, NZDJPY & CADJPY Flash Maximum Weakness
  FxWirePro: GBP/NZD remains weak, eyes 38.2%fib support
  FxWirePro: USD/CNY dips to hit three year low,scope for further downside
  JPY Currency Meter Signals: NZDJPY Bullish (+25) vs CHFJPY (-100) – These Pairs Could Move Next
  FxWirePro: USD/CAD retreats after Canada posts stronger-than-expected GDP growth
  Nikkei Surges Past 65,000 on Suspected Yen Weakness: Tech Giants Like Advantest and NEC Lead Explosive Gains
  FxWirePro: NZD/USD consolidates overnight gains, but loses momentum
  US Magnificent 7 Stocks Trend Score: Amazon & Microsoft Hit Extreme Bullish (+100) as Meta Drops to -100 — Key Resistance & Support Watchlist
  FxWirePro: AUD/USD cedes early gains ,outlook bearish
  FxWirePro: GBP/AUD bears maintain upper hand
  FxWirePro: AUD/USD gains some ground but outlook is bearish


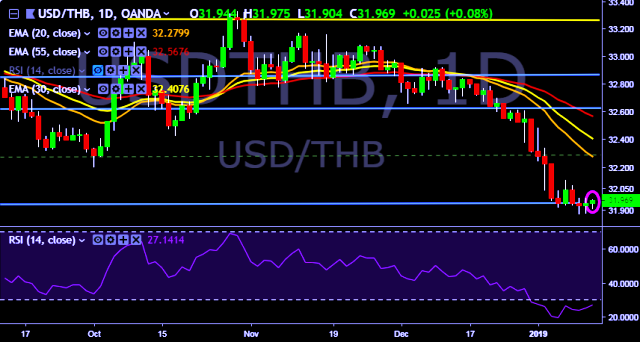
- USD/THB is currently trading around 31.96 marks.
- It made intraday high at 31.98 and low at 31.90 marks.
- Intraday bias remains neutral for the moment.
- On the top side, key resistances are seen at 32.02, 32.10, 32.22, 32.48, 32.70, 32.83 and 32.92 marks respectively.
- Alternatively, a daily close below 31.92 will drag the parity down towards key supports around 31.85, 31.60 and 31.24 marks respectively.
- Important to note here that 20D, 30D and 55D EMA heads down and confirms the bearish trend in a daily chart.
We prefer to take short position on USD/THB only below 31.87, stop loss at 32.10 and target of 31.60/31.24.


