


 FxWirePro: AUD/ USD strongly bearish despite upside attempts
  FxWirePro: EUR/AUD loses upside momentum but outlook is bullish
  FxWirePro: NZD/USD jumps after US and Iran agree preliminary deal
  FxWirePro: EUR/ NZD uptrend loses steam, remains on bullish path
  Peace Dividend Powers NZDJPY Past 93.50 — Bulls Set Sights on 96.15 Target
  Ethereum Cracks Under $1,700: Sell the Rally Near $1,750 as Bears Eye $1,380–$1,200
  FxWirePro: USD/ZAR edges higher, set to stay on back foot
  FxWirePro: GBP/AUD eases on Geopolitical whipsaw
  FxWirePro- Woodies pivot (Major)
  Relief Rally Extends to 112.75, but AUDJPY EMA Structure Favors Selling
  Geopolitical Easing Fuels AUDJPY Rally Toward 115 — Buy Dips at 113
  FxWirePro: AUD/USD climbs as US-Iran peace deal sparks risk rally
  GBPJPY Coil Tightens: Is a Bullish Break Above 215.60 Imminent?
  Sell the Bounce: NZDJPY Bearish Bias Persists Below 94.20, Eyes 90.50


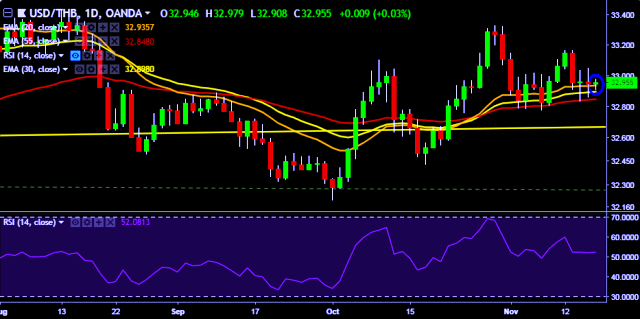
- USD/THB is currently trading around 32.96 marks.
- It made intraday high at 32.98 and low at 32.90 marks.
- Intraday bias remains neutral for the moment.
- On the top side, key resistances are seen at 33.02, 33.15, 33.32, 33.52, 33.78 and 33.96 marks respectively.
- Alternatively, a daily close below 32.94 will drag the parity down towards key supports around 32.78, 32.57, 32.42, 32.20 and 32.07 marks respectively.
- Important to note here that 20D, 30D and 55D EMA heads up and confirms the bullish trend in a daily chart.
We prefer to take long position on USD/THB only above 33.02, stop loss 32.80 and target of 33.52.


