


 Major European Indices Score Extremely Bullish: DAX Eyes 26000, CAC Targets 8600, FTSE100 at 11000 – Key Levels to Watch
  FxWirePro- Major Crypto levels and bias summary
  FxWirePro: GBP/USD rises as soft US data pressures dollar
  FxWirePro: USD/CNY dips to hit three year low,scope for further downside
  FxWirePro: AUD/USD gains some ground but outlook is bearish
  US Magnificent 7 Stocks Trend Score: Amazon & Microsoft Hit Extreme Bullish (+100) as Meta Drops to -100 — Key Resistance & Support Watchlist
  JPY Currency Meter Signals: NZDJPY Bullish (+25) vs CHFJPY (-100) – These Pairs Could Move Next
  AUD/JPY Slips Below 112 as BOJ Intervention Sparks Bearish Momentum: Sell the Rallies
  FxWirePro- Major Crypto levels and bias summary
  AUDJPY Volatile After Massive Sell-Off: Sell Rallies at 113, Targeting 110 as Bearish Momentum Surges
  NZDJPY Retreats on Yen Strength – Bearish Setup Targets 90 After Hitting 92.75 Low
  Major FX Action Bias & US Market Sentiment: NZD/USD (Extremely Bullish) & AUD/USD (Bullish) Watchlist
  FxWirePro: NZD/USD consolidates overnight gains, but loses momentum
  FxWirePro: USD/CAD retreats after Canada posts stronger-than-expected GDP growth
  FxWirePro: GBP/NZD remains weak, eyes 38.2%fib support


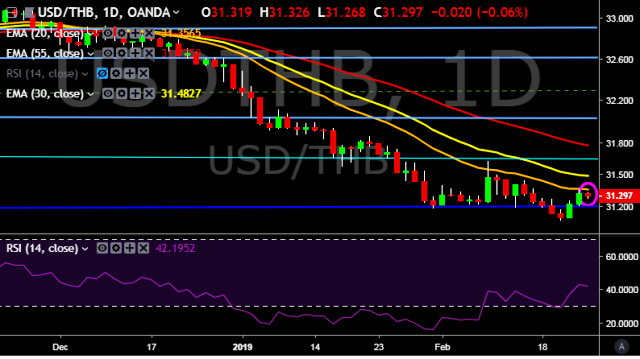
- USD/THB is currently trading around 31.30 marks.
- It made intraday high at 31.33 and low at 31.26 marks.
- Intraday bias remains bullish till the time pair holds key support at 31.20 mark.
- On the top side, key resistances are seen at 31.30, 31.44, 31.62, 31.70, 31.93, 32.02 and 32.10 marks respectively.
- Alternatively, a daily close below 31.22 will drag the parity down towards key supports around 31.10, 30.94, 30.20 and 29.66 marks respectively.
- Important to note here that 20D, 30D and 55D EMA heads down and confirms the bearish trend in a daily chart. Current upside movement is short term trend correction only.
We prefer to take long position on USD/THB only above 31.35, stop loss at 31.20 and target of 31.44/31.62 mark.


