


 UBS Projects Mixed Market Outlook for 2025 Amid Trump Policy Uncertainty
  FxWirePro: USD/ZAR edges higher, set to stay on back foot
  Fed May Resume Rate Hikes: BofA Analysts Outline Key Scenarios
  BTC’s Bear Bounce: Sell the Rally Near $66K as Bears Target $59K–$52K Breakdown
  Oil Prices Dip Slightly Amid Focus on Russian Sanctions and U.S. Inflation Data
  Goldman Predicts 50% Odds of 10% U.S. Tariff on Copper by Q1 Close
  US Gas Market Poised for Supercycle: Bernstein Analysts
  2025 Market Outlook: Key January Events to Watch
  FxWirePro: GBP/USD range-bound as Iran uncertainty keeps traders cautious
  FxWirePro: USD/CAD steadies around 1.3990 ,retains bid one
  Geopolitical Easing Fuels AUDJPY Rally Toward 115 — Buy Dips at 113
  UBS Predicts Potential Fed Rate Cut Amid Strong US Economic Data
  Wall Street Analysts Weigh in on Latest NFP Data
  FxWirePro: EUR/ NZD uptrend loses steam, remains on bullish path


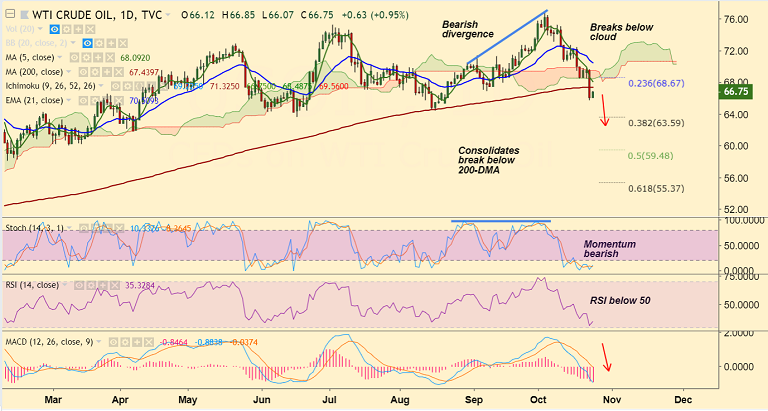
US oil chart on Trading View used for analysis
- Oil slips lower after Saudi promised to supply the Iranian shortfall.
- WTI fell below 200 DMA for the first time in more than a year as a result.
- Further American Petroleum Institute said on Tuesday U.S. crude stocks had risen by 9.9 million barrels - more than forecast.
- Focus now on the U.S. government's supply report (EIA data) which is due at 1430 GMT.
- Technical studies are bearish, momentum with the bears. Scope for further weakness.
- Next major bear target lies at 63.59 (38.2% Fib). Retrace above 200-DMA negates near-term bearishness.
Support levels - 64.45 (Aug 16 low), 63.59 (38.2% Fib)
Resistance levels - 67.44 (200-DMA), 68.10 (5-DMA)
Recommendation: Good to stay short on upticks, SL: 67.50, TP: 66/ 65.35/ 64.50
For details on FxWirePro's Currency Strength Index, visit http://www.fxwirepro.com/currencyindex.


