
The WTI crude oil prices extend their recent recovery upto the current $71.07 levels, with WTI particularly supported by hurricane risks.
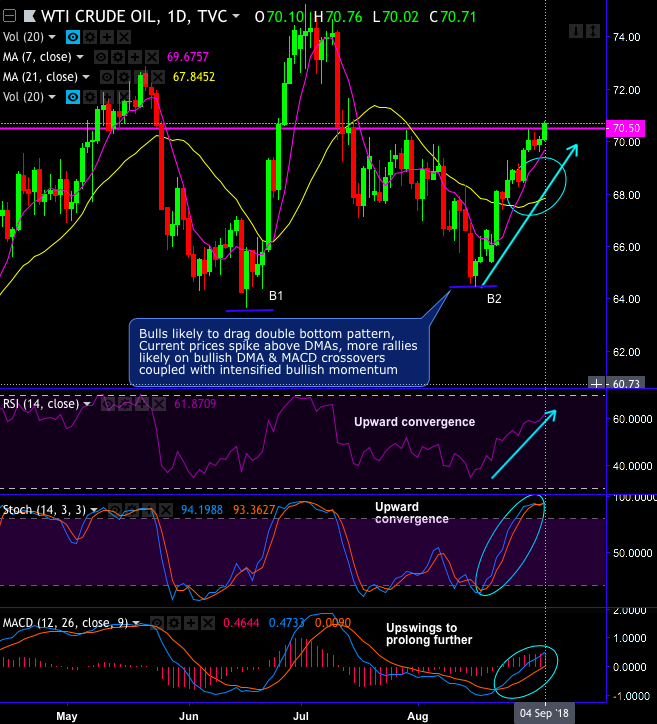
Technically, WTI crude on daily plotting forms double bottom pattern which is bullish in nature formed with bottom 1 at $63.62 and bottom 2 at $64.45 levels.
For now, the bulls most likely to drag this bullish pattern, the current prices spike above DMAs, more rallies likely on bullish DMA & MACD crossovers coupled with intensified bullish momentum.
While the consolidation phase breaks symmetric triangle resistance (refer monthly chart), as a result, the uptrend retraces 50% Fibonacci levels of the lows of February 2016 (i.e. $26.08) and the highs of May’2011 (i.e. $114.79 levels). That is where, trend seems to be slightly edgy as the bears resume on shooting star and hanging man formations, both leading oscillators signal OB pressures.
Momentum and trend study: The prevailing uptrend to sustain upon bullish DMA and MACD crossovers that is coupled with intensified bullish momentum as both leading oscillators (RSI & stochastic curves) show upwards convergence to the price rallies on daily terms, where these momentum oscillators indicate overbought pressures at this juncture.
Overall, on trading grounds, it is good to buy at current levels for further upside traction upto $71.92 levels for the strict stop loss of $71.00 levels.
Currency Strength Index: FxWirePro's hourly USD spot index is inching towards 140 levels (which is bullish), while articulating (at 10:30 GMT). For more details on the index, please refer below weblink:



