


 Indonesia Surprises Markets with Interest Rate Cut Amid Currency Pressure
  Geopolitical Shocks That Could Reshape Financial Markets in 2025
  AUDJPY Bears Take a Breather at 111.50, But ‘Sell on Rallies’ Still Eyes 110
  Stock Futures Dip as Investors Await Key Payrolls Data
  U.S. Stocks vs. Bonds: Are Diverging Valuations Signaling a Shift?
  NZDJPY: The Kiwi Yen's Bull Run Hits a Brick Wall at 92 — Sell the Rally?
  FxWirePro- Major Crypto levels and bias summary
  Goldman Predicts 50% Odds of 10% U.S. Tariff on Copper by Q1 Close
  European Stocks Rally on Chinese Growth and Mining Merger Speculation
  Fed May Resume Rate Hikes: BofA Analysts Outline Key Scenarios
  Gold Prices Slide as Rate Cut Prospects Diminish; Copper Gains on China Stimulus Hopes
  US Futures Rise as Investors Eye Earnings, Inflation Data, and Wildfire Impacts
  Moldova Criticizes Russia Amid Transdniestria Energy Crisis
  FxWirePro: USD/JPY edges higher as the yen remains vulnerable despite repeated warnings of intervention.
  UBS Projects Mixed Market Outlook for 2025 Amid Trump Policy Uncertainty
  FxWirePro- Woodies pivot (Major)


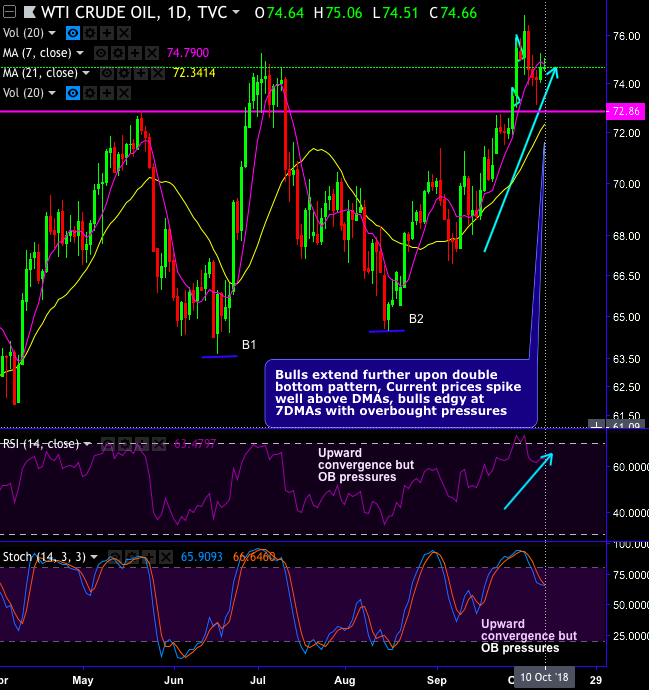
The WTI crude oil price rallies are struggling to extend their recent recoveries but holding stronger at 7DMAs, currently trading at around $74.61 levels.
Technically, WTI crude on daily plotting, bulls are extending double bottom pattern which is bullish in nature.
Double bottom formed with bottom 1 at $63.62 and bottom 2 at $64.45 levels. For now, this bullish pattern continuation is staged as strong support is seen at $72.86 levels.
Even though if any abrupt price dips are seen on overbought pressures, then, it is perceived as better entry levels to build longs.
While the consolidation phase breaks-out symmetric triangle resistance (refer monthly chart), as a result, the uptrend retraces more than 50% Fibonacci levels of the lows of February 2016 (i.e. $26.08) and the highs of May’2011 (i.e. $114.79 levels). That’s where, the trend seemed slightly edgy with occurrences of shooting star and hanging man formations. For now, bulls bounce back well beyond EMAs and 50% Fibonacci levels and now on the verge of hitting 61.8% Fibonacci levels.
Momentum and trend study: The prevailing uptrend to sustain upon bullish DMA and MACD crossovers.
But both momentum oscillators (RSI & stochastic curves) signal overbought pressures at this juncture on both timeframes.
While energy prices sneaked past ($80 in case of brent and $76.24 in case of WTI) a barrel as mining nations like Russia and Saudi Arabia decided against mounting global production at a meeting in Algiers.
Overall, on hedging grounds, it is wise to capture minor price dips and we advocate initiating longs in WTI CME futures contracts with a view to arresting further upside risks.
Currency Strength Index: FxWirePro's hourly USD spot index is inching towards -48 levels (which is bearish), while articulating (at 13:36 GMT).
For more details on the index, please refer below weblink:


