


 Forex Scorecard: EUR/USD, GBP/USD, and NZD/USD Stand Out as Prime Bullish Opportunities
  FxWirePro- Major Crypto levels and bias summary
  AUDJPY Bears Tighten Grip: Sell Rallies at 110.65-67 Targeting 107.75 as All EMAs Stay Red
  Gold Retreats as Geopolitical Fears Ease: Bears Target $4,000 Support
  US Magnificent 7 Stocks Trend Score: Amazon & Microsoft Hit Extreme Bullish (+100) as Meta Drops to -100 — Key Resistance & Support Watchlist
  FxWirePro: AUD/USD cedes early gains ,outlook bearish
  All Major JPY Pairs Hit Extreme Bearish Score of -100: USDJPY, EURJPY, GBPJPY, AUDJPY, NZDJPY & CADJPY Flash Maximum Weakness
  FxWirePro:USD/JPY climbs back above 160.00 after BOJ rate decision
  NZDJPY Retreats on Yen Strength – Bearish Setup Targets 90 After Hitting 92.75 Low
  FxWirePro: USD/CNY dips to hit three year low,scope for further downside
  FxWirePro- Woodies pivot (Major)
  AUDJPY Volatile After Massive Sell-Off: Sell Rallies at 113, Targeting 110 as Bearish Momentum Surges
  FxWirePro: NZD/USD consolidates overnight gains, but loses momentum
  DAX & CAC40 Score Perfect 100 Trend, FTSE100 Lags at 85 – Key Levels to Watch on the Perfect Scorers
  FxWirePro: GBP/NZD remains weak, eyes 38.2%fib support
  FxWirePro: AUD/USD gains some ground but outlook is bearish


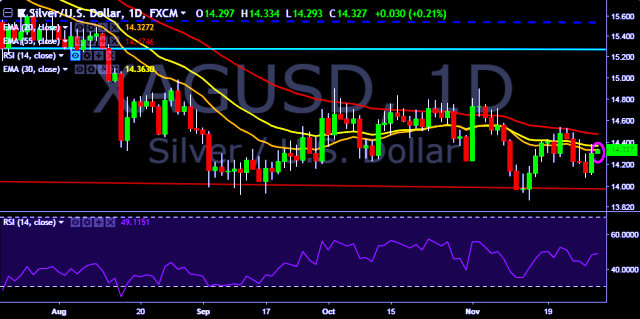
- XAG/USD is currently trading around $14.32 marks.
- It made intraday high at $14.33 and low at $14.29 levels.
- Intraday bias remains bullish for the moment.
- A daily close above $14.32 will test key resistances at $14.42, $14.57, $14.72 and $14.78 marks respectively.
- On the other side, a daily close below $14.32 will take the parity down towards key supports at $14.22, $14.17, $14.07, $13.90, $13.82, $13.68 and 13.51 marks respectively.
- Important to note here that 20D, 30D and 55D EMA heads down and confirms the bearish trend in a daily chart.
We prefer to take long position on XAG/USD around $14.30, stop loss $14.21 and target of $14.57.


