


 JPY Currency Meter Signals: NZDJPY Bullish (+25) vs CHFJPY (-100) – These Pairs Could Move Next
  FxWirePro- Major Crypto levels and bias summary
  FxWirePro: NZD/USD consolidates overnight gains, but loses momentum
  AUD/JPY Slips Below 112 as BOJ Intervention Sparks Bearish Momentum: Sell the Rallies
  Major FX Action Bias & US Market Sentiment: NZD/USD (Extremely Bullish) & AUD/USD (Bullish) Watchlist
  FxWirePro: USD/CNY dips to hit three year low,scope for further downside
  US Magnificent 7 Stocks Trend Score: Amazon & Microsoft Hit Extreme Bullish (+100) as Meta Drops to -100 — Key Resistance & Support Watchlist
  FxWirePro: GBP/NZD remains weak, eyes 38.2%fib support
  FxWirePro: AUD/USD gains some ground but outlook is bearish
  FxWirePro- Woodies pivot (Major)
  FxWirePro- Major Pair levels and bias summary
  FxWirePro- Major Pair levels and bias summary
  FxWirePro: USD/CAD retreats after Canada posts stronger-than-expected GDP growth
  NZDJPY Retreats on Yen Strength – Bearish Setup Targets 90 After Hitting 92.75 Low
  FxWirePro:USD/JPY climbs back above 160.00 after BOJ rate decision
  FxWirePro: GBP/USD rises as soft US data pressures dollar


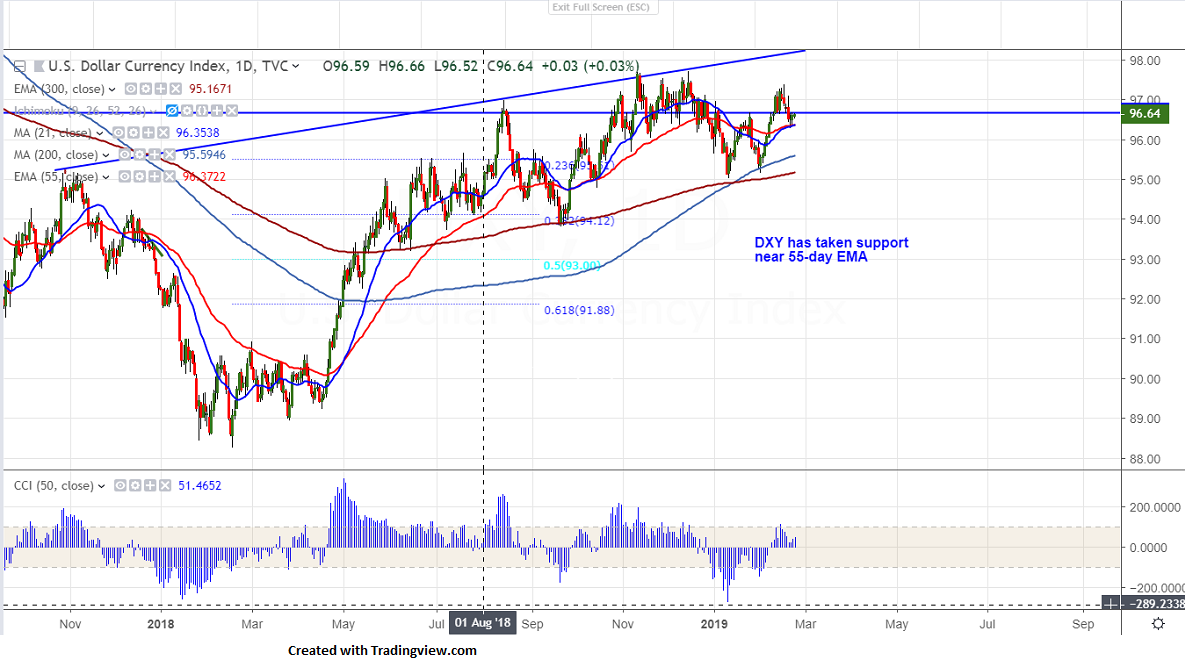
DXY is trading flat after hitting low of 96.29 on Feb 20th 2019. The index jumped till 96.66 and is hovering around that level. The index has taken support after showing a minor decline below 50- day MA. It is currently trading around 96.64.
On the lower side, near term major support is around 96.31 (50-day MA) and any break below will drag the index down till 96/95.57 (200- day MA). The index should break below 95.16 (300-day EMA) for further weakness.
The near term resistance is around 96.71 (38.2% fib) and any break above will take the DXY to next level 97/97.37 (Feb 15th 2019 high). Any break above 97.71 confirms further bullish continuation.
It is good to sell on rallies around 96.75-80 with SL around 97.20 for the TP of 95.60.


