


 FxWirePro:GBP/AUD slips as markets assess Burnham's rise to UK premiership
  NZDJPY Bullish Above 95: Buy Dips Toward 97 as Kiwi Strength Holds Firm
  FxWirePro: GBP/NZD dips as sterling eases as Burnham steps in
  FxWirePro: GBP/USD falls as investors assess Britain's political transition
  FxWirePro- Woodies pivot (Major)
  FxWirePro- USD/CHF Holds Above 0.8120 as Bulls Target 0.8200
  FxWirePro: GBP/AUD dips amid heightened Geopolitical concerns
  FxWirePro:USD/JPY hovers near 40-year peak,intervention fears linger
  FxWirePro: GBP/NZD downtrend loses steam, remains on bearish path
  BTCUSD Holds Above 365 EMA as Bullish Momentum Builds Toward $70K
  Major Pairs Action Bias: NZDUSD Turns Extremely Bullish as EURUSD Stays Bearish – AUDUSD Emerges as Key Bullish Pair to Watch
  FxWirePro- Major Pair levels and bias summary
  FxWirePro: EUR/NZD outlook weaker on renewed downside pressure
  FxWirePro: USD/CAD advances as loonie dips on softer Inflation and Middle East uncertainty
  AUDJPY Surges on Aussie Strength: Buy Dips Toward 117/118 as Bullish Momentum Accelerates
  FxWirePro: AUD/USD bulls struggles as upside momentum fades
  FxWirePro: EUR/ AUD dips below 1.6300 level, focus on near term support


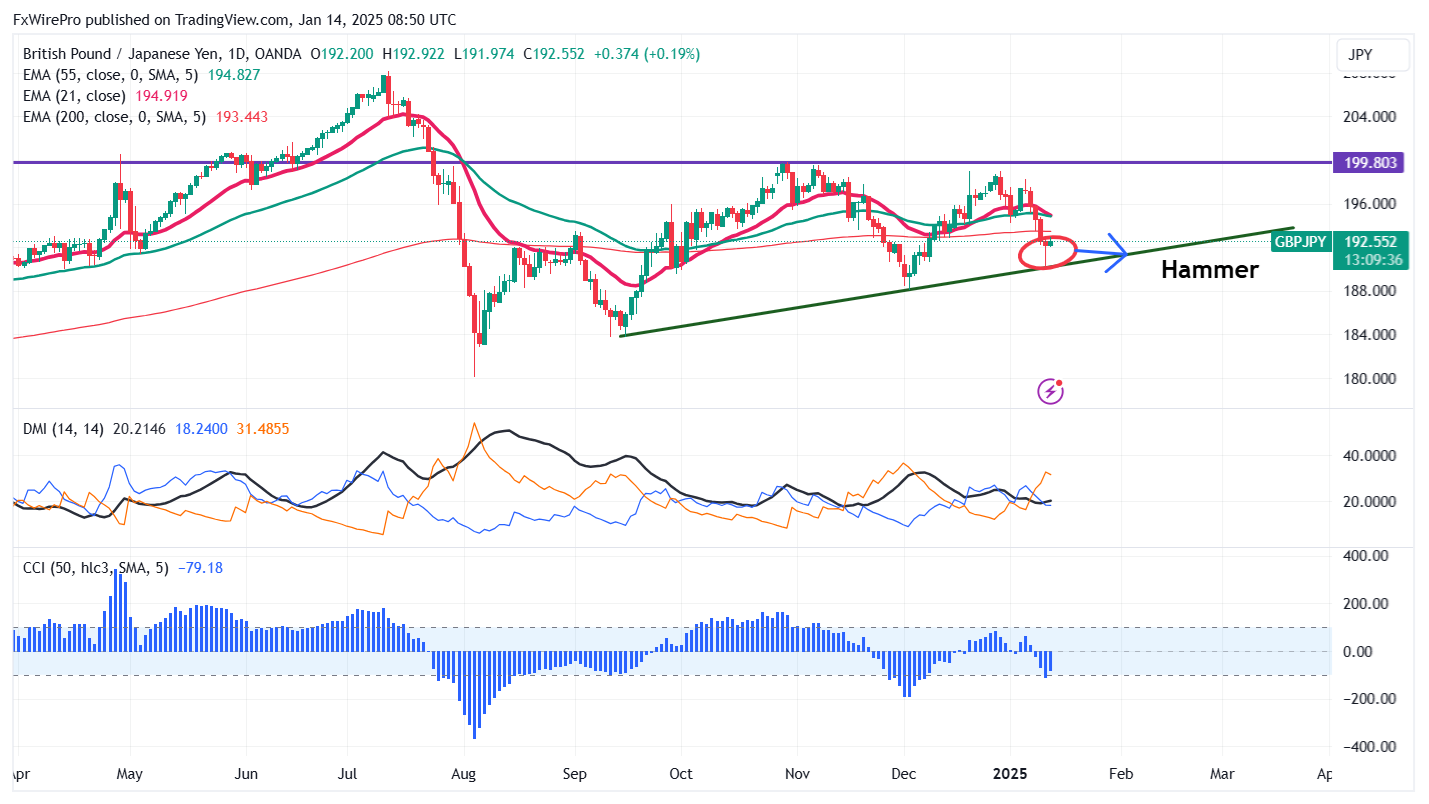
Candlestick- Hammer (daily chart)
The GBP/JPY took support near the trend line and showed a minor pullback as the pound sterling recovered. It hit an intraday high of 192.92 and currently trading around 192.496. Intraday trend is bullish as long as support 190 holds.
Technical Analysis of GBP/JPY
The GBP/JPY pair is trading below 34 and 55 EMA (Short-term) and 200 EMA (long-term) on the 4-hour chart, confirming an overall downtrend. Immediate resistance is at 193.45; a breach above this level targets 194.52/195/195.60/196.25/197. Downside support is at 191.80 with additional levels at 191/190.
Market Indicators
CCI (50)- Bearish
Directional movement index - Bearish
It is recommended to buy on dips around 192.38-40 with a stop-loss at 191.50 for a TP of 195/195.60.


