
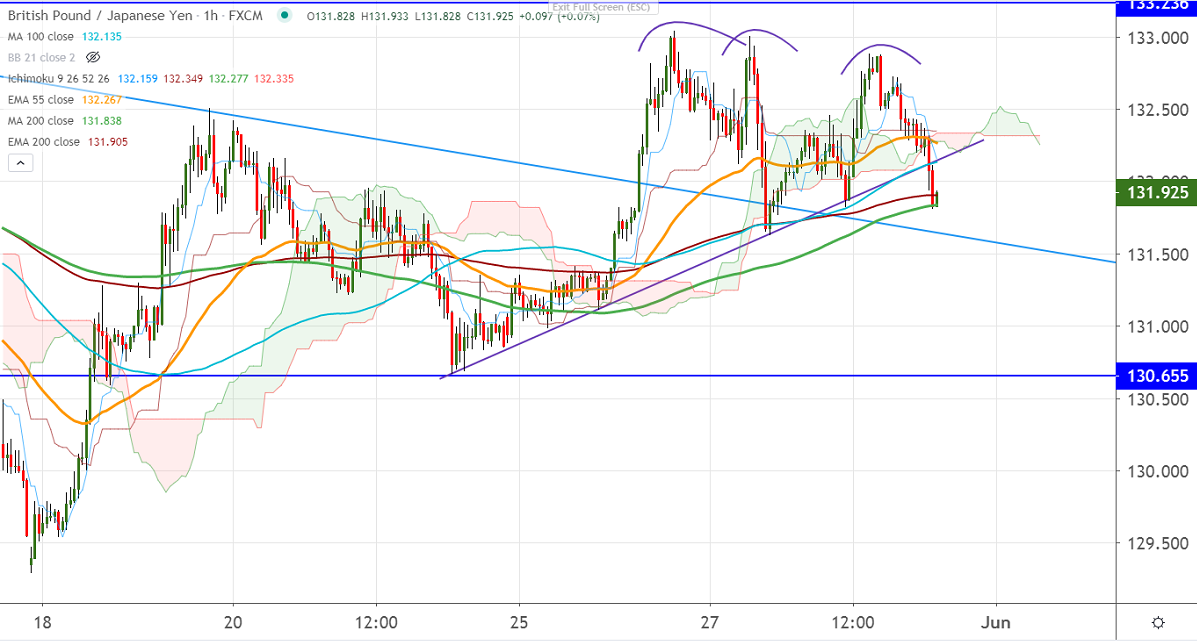
Ichimoku Analysis (1-hour chart)
Tenken-Sen- 132.31
Kijun-Sen- 132.35
GBPJPY has once declined after showing a jump to 132.88. The pair has formed almost a triple top near 133. The decline was mainly due to strong yen as US and China trade tension escalates. USDJPY upside capped by 200-day MA at 108.30and further trend continuation only if it closes above that level. The GBP showed a dip to 131.817 against JPY and is currently trading around 131.84.
In the 4 hours chart it is hovering near 200-H MA at 131.84, any hourly break below confirms intraday weakness. A decline till 131.40/130.66 is likely. Any indicative break below 130.65 targets 130/129.25.
On the flip side, near-term resistance stands at 133.18 and any violation beyond will take the pair to next level till 134/135./135.75.
It is good to sell on rallies around 132.15-20 with SL around 133 for the TP of 130.05/129.25.


