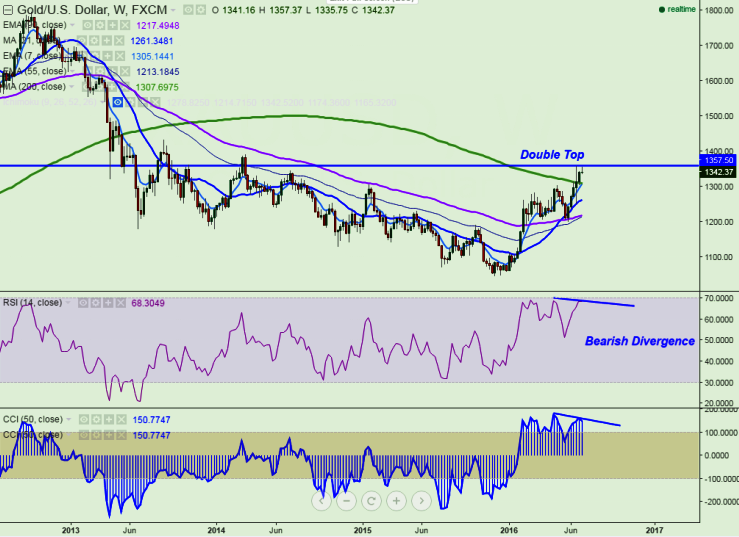
Gold forms bearish divergence in weekly chart, dip till $1305 is possible
Major resistance- $1358 (Jun 24th high) Major support - $1318 (3 WMA) Pattern Formed- Bearish Divergence (CCI (50) and RSI (14) in weekly chart) The yellow metal has formed a double top around $1358 and started to declin…
Pattern Formed- Bearish Divergence (CCI (50) and RSI (14) in weekly chart)
The yellow metal has formed a double top around $1358 and started to decline from that level. It is currently trading at $1342.
Gold is facing strong resistance around $1358 and any break above $1358 will take the yellow metal to next level $1372/$1392 (161.8% retracement of $1358 and $1304) level in the short term.
On the lower side, any break below $1318 will drag the commodity down till $1305 (daily Tenkan-Sen)/$1290.
In weekly chart, gold has formed bearish divergence .So dip till $1318/$1305 is possible.
Short term bullish invalidation only below $1290.
It is good to sell on rallies around $1345-48 with SL around $1358 for the TP of $1320/$1306