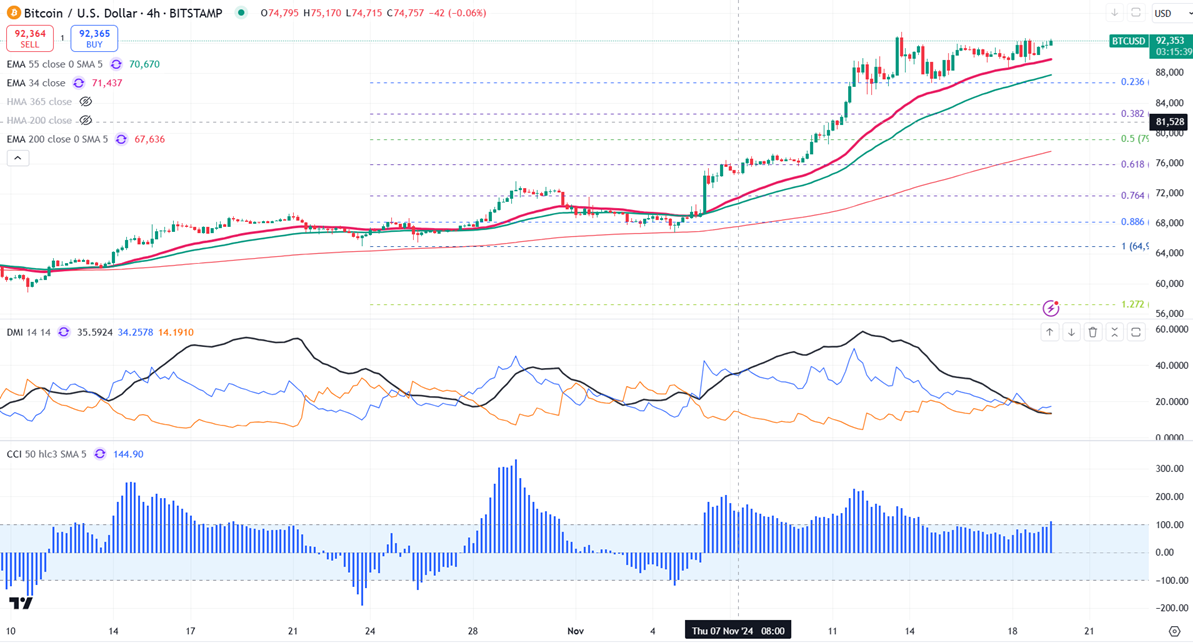
Bitcoin (BTCUSD) is consolidating after hitting a fresh all-time high of $93,483 and is currently trading around $91,298.
MicroStrategy's Massive Bitcoin Acquisition
MicroStrategy recently made headlines by purchasing 51,780 Bitcoin (BTC) for about $4.6 billion, marking one of the largest purchases to date. With this acquisition, the company now holds a total of 331,200 BTC, making it the biggest corporate holder of Bitcoin in the world. The Bitcoin was purchased at an average price of $88,627 per BTC, adding to MicroStrategy's total investment in Bitcoin of approximately $16.5 billion since 2020. Following this news, MicroStrategy's stock (MSTR) has seen significant changes, reflecting how investors feel about the company's aggressive Bitcoin strategy.
Surge in Bitcoin ETF Inflows
Following Goldman Sachs' announcement about its investments in Bitcoin exchange-traded funds (ETFs), the market has experienced a surge in inflows. Recently, Bitcoin ETFs attracted around $1.48 billion in new investments, indicating growing interest from institutional investors. Goldman Sachs has raised its Bitcoin ETF assets to $710 million, a 71% increase since the second quarter of 2024, including a $300 million addition. Notable investments include $461 million in BlackRock’s iShares Bitcoin Trust, $96 million in Fidelity’s Wise Origin Bitcoin Fund, $72 million in Grayscale, and $60 million in Invesco. The rise in ETF inflows reflects a broader trend of cryptocurrencies gaining acceptance among institutions as regulatory clarity improves.
Technical Analysis and Price Levels
BTCUSD trades above the short-term moving averages (34-EMA and 55-EMA) and the long-term moving average (200-EMA) in the daily chart. Minor support is at $86,700; any break below this level will target $84,000, $80,000, or $75,800.
Bullish Scenarios and Investment Strategy
In a bullish scenario, the primary supply zone is at $95,000. A break above this level would confirm intraday bullishness, with a potential jump to $100,000. A secondary barrier at $100,000 suggests that a close above this level could target $110,000. Indicators on the 4-hour chart, such as a bullish Commodity Channel Index (CCI) and Average Directional Movement Index, support this positive outlook. An investment strategy could involve buying on dips around $80,000, with a stop-loss set around $76,000 for a target price of $100,000.


 FxWirePro- Major Crypto levels and bias summary
  BTC Flat at $89,300 Despite $1.02B ETF Exodus — Buy the Dip Toward $107K?
  FxWirePro- Major Crypto levels and bias summary


