


 Citi Raises TSMC Price Target as AI Chip Demand Strengthens Growth Outlook
  Jamie Dimon Warns Anthropic's Mythos AI Poses National Security Risks
  Morgan Stanley Says China’s Reusable Rocket Progress Poses Long-Term Challenge to SpaceX
  Bank of America Upgrades T-Mobile to Buy, Says LEO Satellite Fears Are Overdone
  UBS Boosts China Tech Bets, Adds Kuaishou and Meituan to Focus List
  Goldman AM Sees Strong Buyout Opportunities in Japan, South Korea and Australia


Gold hits fresh all-time high on easing US bond yields. It hit a low of $2638 yesterday and is currently trading around $2653.60.
Geopolitical uncertainties-
The current unrest in the Middle East is largely fueled by the ongoing conflict between Israel and militant groups, especially Hamas and Hezbollah. This situation is intensified by regional factors involving Iran and other countries. This has led to a heightened interest in safe-haven assets.
US treasury yield-
In recent weeks, there has been a significant decline in U.S. 10-year Treasury yields, indicating changing economic expectations and the impact of monetary policy. As of mid-October 2024, the yield on the 10-year Treasury note stands at approximately 4.02%, having fallen from this week’s peak of 4.14%, with analysts anticipating additional drops in the months ahead.
US dollar index-
The US dollar index broke the previous week at 103.17 after a long consolidation. Any break above 103.40 confirms a bullish continuation.
Based on the CME FedWatch Tool, the likelihood of a 25 basis point rate cut in November has risen to 94.2%, up from 80.3% just a week ago.
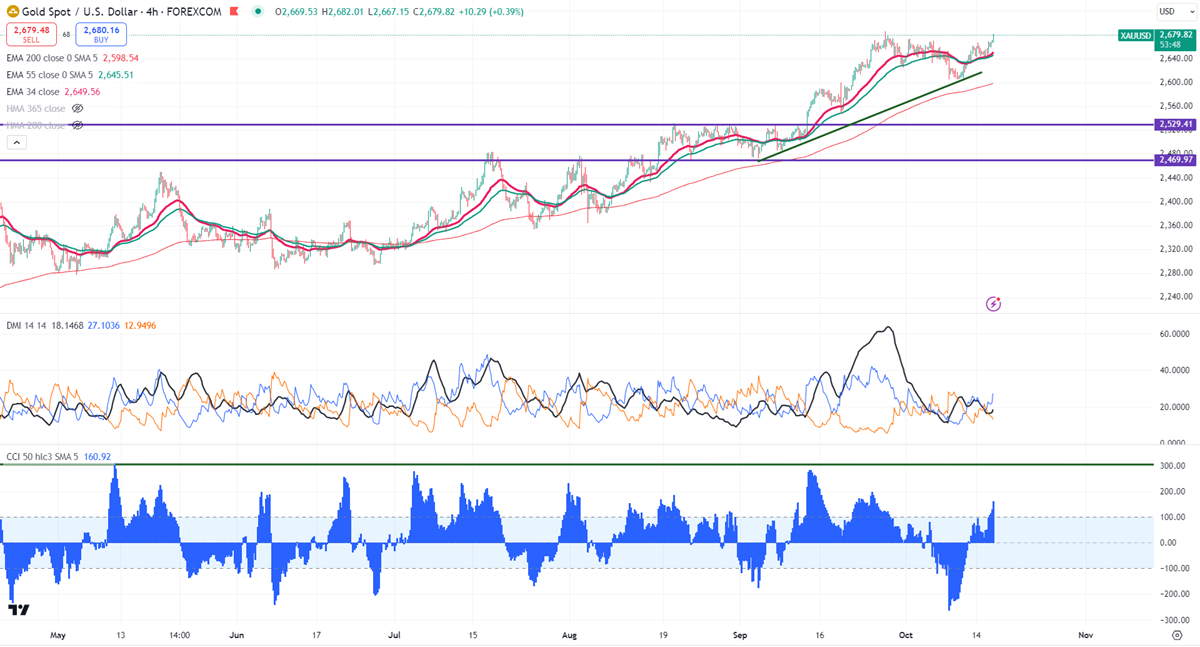
Technical (4 hour chart)-
The yellow metal trades above short term (34 and 55 EMA ) and long-term (200- and 365 Hull MA) in the 4-hour chart.
The near–term support is around $2660, a break below targets $2638/$2624/$2600/$2570/$2560/$2545/$2520/$2470. Major bearish continuation only below $2470.The yellow metal faces minor resistance around $2680 and a breach above will take it to the next level of $2689/$2700/$2713.
Indicator (4- hour chart)
CCI (50)- Bullish
Average directional movement Index - Bullish
It is good to buy on dips around $2660 with SL around $2638 for TP of $2710.


