


 Goldman Sachs Raises USD/JPY Forecast, Sees Yen Weakness Persist Through 2027
  JPMorgan Cuts Gold Price Forecast, Sees Bullion Reaching $4,500 by End of 2026
  Bank of America Upgrades T-Mobile to Buy, Says LEO Satellite Fears Are Overdone
  Bernstein Names IAG, Ryanair as Top European Airline Stocks Ahead of Earnings
  Goldman Sachs Flags 3 Key Risks Ahead of Europe’s Earnings Season


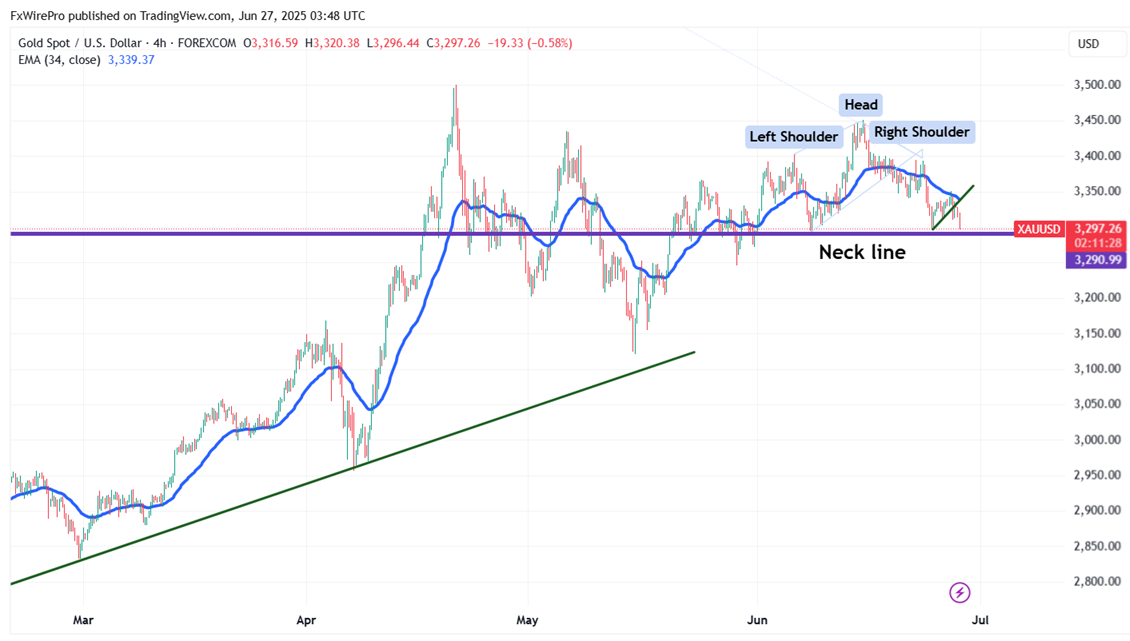
Chart pattern-Head and Shoulder
Gold pared most of its gains as US and China trade tension eases. It hits an intraday low of $3304 and is currently trading around $335.36.
US President Donald Trump announced a new trade agreement with China, presented as one of several "great deals," and foreshadowed a "very big" trade deal with India. While emphasizing the agreement's significance and hinting at tariffs for non-compliant nations, Trump provided few specifics on the China deal. However, reports indicate provisions for rare earth mineral shipments and a 90-day framework to reduce existing tariffs (55% on Chinese goods by the US, 10% on US goods by China). This development has temporarily eased global market tensions and suggests further negotiations, especially with India, are on the horizon.
Markets eye US PCE data for further direction.
Rate Pause Expectations Shift
According to the CME Fed Watch tool, the chances of rate pause in Jul 30th 2025 meeting have decreased to 80.4% from 87.20% a week ago.
Technical Analysis: Key Levels and Trading Strategy
Gold prices are holding below short term moving average 34 EMA and 55 EMA and above long-term moving averages (200 EMA) on the 4-hour chart. Immediate support is at $3340 and a break below this level will drag the yellow metal to $3330/$3300. The near-term resistance is at $3385 with potential price targets at $3400/43420$3450/$3475/$3500/$3550.
It is good to sell below $3295 with a stop-loss at $3340 for a target price of $3000.


