


 SpaceX Targets Thursday Launch for Starship's 13th Test Flight After Last-Minute Delay
  TSMC Sees Multi-Year AI Chip Demand as Arizona Expansion Reaches $265 Billion
  Morgan Stanley Downgrades Adobe, Workday as AI Transition Raises Growth Concerns
  KAIST, Stanford Develop Self-Dressing Robot for Cleanrooms and Emergency Gear
  Wistron Opens $700M Texas AI Factory to Build Nvidia Superchips in U.S.
  Intel, AMD Seek Long-Term China Server CPU Deals as AI Demand Drives Supply Crunch
  Samsung Electronics America to Cut 739 New Jersey Jobs as Texas Headquarters Move Advances
  Nvidia Reveals 9.3% Stake in AI Cloud Firm Nebius Following $2 Billion Investment
  Bank of America Says These Overlooked AI Stocks Could Be the Next Winners
  Elon Musk Fuels SpaceX-Tesla Merger Speculation After Earnings Call
  DeepSeek Eyes $74 Billion Valuation Ahead of Planned China IPO
  Alphabet Q2 Earnings Beat Estimates as AI Spending, Google Cloud Growth Fuel Outlook
  Super Micro Computer Stock Jumps 20% After Record AI Orders and Margin Surge
  ASML Trillion-Dollar Valuation: Can Europe’s AI Chip Giant Reach the Historic Milestone?
  SpaceX Eyes Pentagon AI Deal as Cloud Pricing Strategy Pressures CoreWeave
  OpenAI Australia Data Center Switches Cooling Strategy After Recycled Water Plan Fails


The UK and many other countries worldwide have introduced social distancing measures to slow the spread of the COVID-19 pandemic. To understand if these recommendations are effective, we need to assess how far they are being followed.
To assist with this, our team at the Newcastle University Urban Observatory has developed an urban data dashboard to help understand the impact of social distancing measures on people and vehicle movement within a metropolitan city in real time.
The Newcastle University Urban Observatory was developed to better understand the dynamics of movement in a city. It makes use of thousands of sensors and data sharing agreements to monitor movement around the city, from traffic and pedestrian flow to congestion, car park occupancy and bus GPS trackers. It also monitors energy consumption, air quality, climate and many other variables.
Changing movement
We have analysed over 1.8 billion individual pieces of observational data, as well as other data sources, with deep learning algorithms. These inform and update the dashboard in real time.
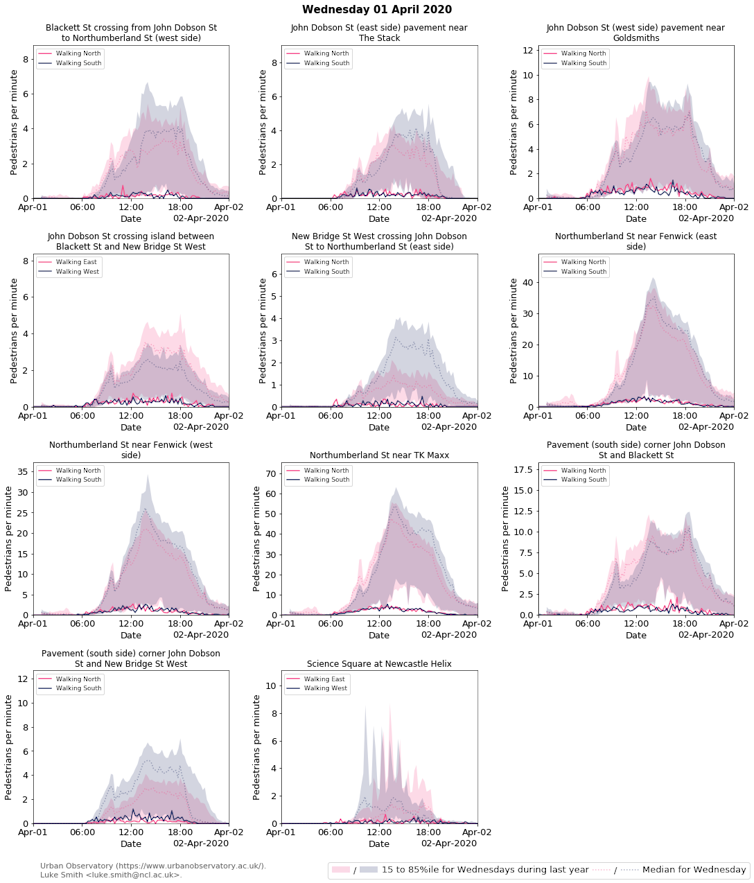
People Movement Monitoring Dashboard. The Newcastle Urban Observatory
In the graphic above, real-time data from pedestrian sensors is shown as solid lines. The shaded areas are the “normal” pre-lockdown pedestrian flows. Sensors usually monitor pedestrian flows in two directions every hour, which is then compared against the same day from the previous year. Peaks in the graph represent an increased volume of people movement during rush hour. Since the lockdown, however, only very small peaks have been observed overall.
Our research has found that pedestrian movement has reduced by 95% when compared to the annual average. This shows that people have been following government guidelines closely. However, the most profound decrease in footfall only occurred following the strict regulations introduced late on March 23, suggesting that the stronger message had the desired effect.
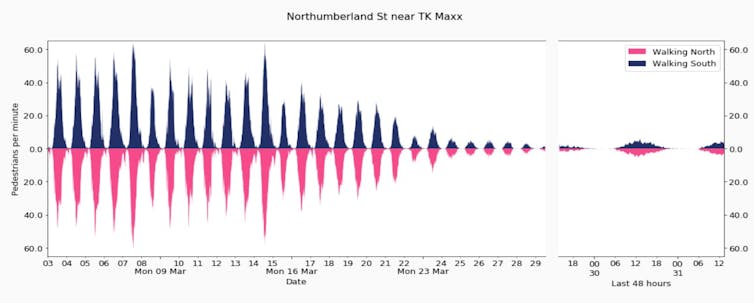
People Movement Indicator. The Newcastle Urban Observatory
In terms of vehicle movement, traffic reduced at a much slower pace to about 50% of the annual average early in the first week of lockdown. This is possibly due to people shifting to using cars rather than public transport. Overall, we estimate there have been 612,000 lost journeys on public transport since March 1 in Tyne and Wear.
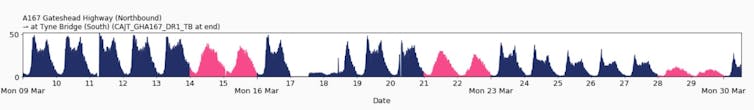
Traffic Movement Indicator. The Newcastle Urban Observatory
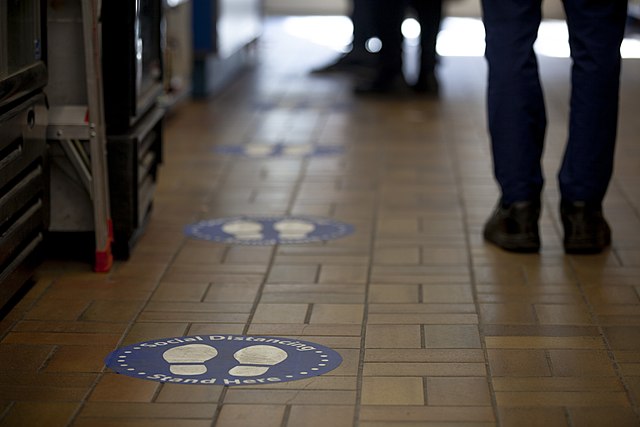
Public Health England has also suggested that people stay a minimum of two metres apart when out and about. This advice has been widely advertised, but it is difficult to assess whether it is being followed. Using computer vision and image processing, our team at the Urban Observatory has developed algorithms that can automatically measure social distancing in public areas.
Measuring Social Distancing through Machine Learning.
We produced models which can measure the distance between pedestrians in public places. Using a traffic light indicator system, the algorithm is able to anonymously identify and label people who maintain safe distances, while flagging certain instances in red where social distancing measures are violated.
Using this information, it is possible to identify bottlenecks where social distancing cannot be maintained, and how citizens adapt as restrictions are imposed or lifted.
This type of data not only shows how physical distancing is changing in real time, but will also provide detailed insight into long-term behavioural changes.
Tools for the future
A World Health Organization expert has claimed that the UK was ten days late in implementing strict social distancing measures. This was perhaps due to a lack of insight into widespread public behaviour. Observational infrastructure developed through technology may lie at the heart of future crisis management responses.
The Newcastle Urban Observatory is part of a global movement to develop what are known as smart cities: where embedded sensors provide real-time data on city systems to optimise performance and enable evidence-based decision making.
Smart cities use information and communication technologies to streamline urban operations on a large scale. Technological ecosystems collect traffic, noise, air quality, energy consumption and movement data in order to make improved and sustainable decisions by authorities and enterprises. Citizens can engage with the smart city in a number of ways.
Data authority and governance will be an important point of discussion in future Smart City development. The Urban Observatory is actively researching the governance of smart cities, and applies an ethos of openness and transparency by publishing all the data in real time.
Our analysis of the current situation presents an opportunity to be better prepared for the next crisis, or to quantify the impacts of large-scale social change.


