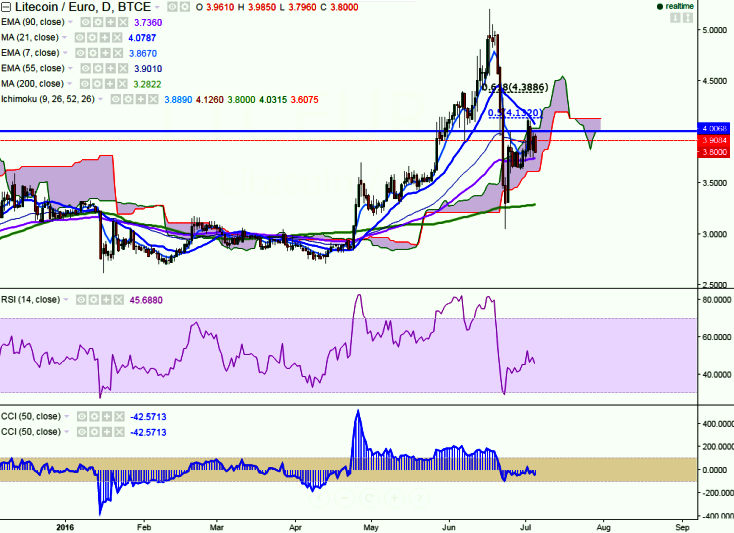
LTC/EUR struggles to close above 4.00, decline till 3.65/3.40 likely
LTC/EUR is seen trading in red on Tuesday. The pair has retreated sharply after making a high of 3.98 levels (BTCE). It is currently trading around 3.80 at the time of writing. Ichimoku analysis of daily chart shows: Ten…
LTC/EUR is seen trading in red on Tuesday. The pair has retreated sharply after making a high of 3.98 levels (BTCE). It is currently trading around 3.80 at the time of writing.
Ichimoku analysis of daily chart shows:
Tenkan-Sen level: 3.88
Kijun-Sen level: 4.126
Trend reversal level - (90 day MA) – 3.73
Long-term trend remains to be bullish. Short- term trend seems to be bearish. In daily chart LTC/EUR is trading well below Tenkan-Sen and Kijun-Sen. So a decline till 3.65/3.40 is possible.
Major resistance is seen at 4 (Jun 25th high) and break above targets 4.11 (21 day MA)/4.38 (61.8% retracement of 5.20 and 3.04). Short term support can be noticed at 3.86 (7 day EMA) and any violation below will drag the pair till 3.59 (Jun 25th low)/3.40 (61.8% retracement of 3.04 and 4.00)/3.04 (Jun 23rd low).
The $0.131 mark was the late-September high; a revisit would depend on Bitcoin (BTC) strengthening and crypto-market sentiment improving. No timeframe was given.