


 FxWirePro- Major Crypto levels and bias summary
  FxWirePro- Major Crypto levels and bias summary
  FxWirePro- Major Crypto levels and bias summary
  FxWirePro- Major Crypto levels and bias summary


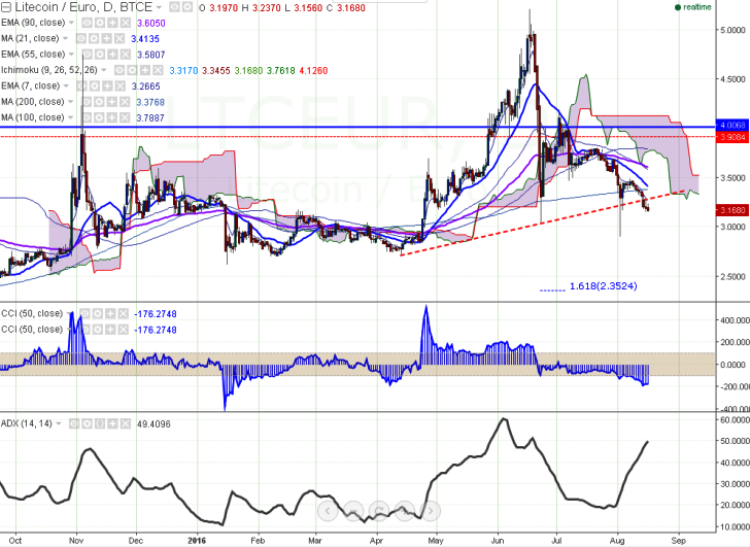
LTC/EUR is seen trading well below on Tuesday. The pair has made a temporary top around 3.49 (Aug 7th high) and declined from that level (BTCE). It is currently trading around 3.168 at the time of writing.
Ichimoku analysis of daily chart shows:
Tenkan-Sen level: 3.32
Kijun-Sen level: 3.35
Trend reversal level - (90 days MA) - 3.615
Long- term trend remains to be neutral. In a daily chart, LTC/EUR is trading well below Tenken-Sen and Kijun-Sen. So a decline till 2.90 is possible.
Major resistance can be noticed at 3.37 (200 days EMA) and break above targets 3.615 (901 days EMA)/3.78 (100 day MA). Short term support is seen at 2.90 (Aug 2nd low) and any violation below will drag the pair till 2.76 (161.8% retracement of 3.04 and 4.145)/2.63.

- News

- Economy

- Central Banks
- Investing
- Research
- Roundups
- Digital Currency
- Insights
- Technical Analysis
- Technology
- Business
- Law
- Health
- Nature
- Fintech
- Science
- Topic
- Opinions
- ©Econometrics LLC . All Rights Reserved.
LTC/EUR trades below 200-day MA, decline till 2.76 likely
Tuesday, August 16, 2016 11:40 AM UTC
Editor's Picks


- Market Data
Most Popular


