LTC/EUR trades slightly above 200-day MA, jump till 2.76/2.63 likely
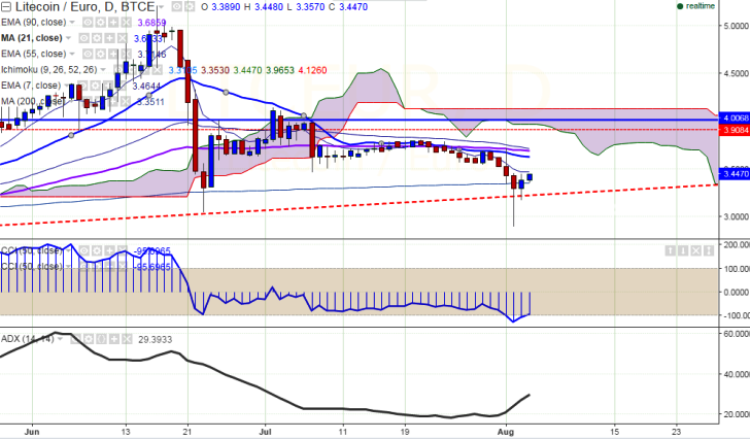
LTC/EUR is seen trading slightly above on Thursday after a decline. The pair has recovered slightly after declining sharply till 2.90 levels (BTCE) on Aug 2nd, 2016. It is currently trading around 3.44 at the time of wri…
LTC/EUR is seen trading slightly above on Thursday after a decline. The pair has recovered slightly after declining sharply till 2.90 levels (BTCE) on Aug 2nd, 2016. It is currently trading around 3.44 at the time of writing.
Ichimoku analysis of daily chart shows:
Tenkan-Sen level: 3.31
Kijun-Sen level: 3.35
Trend reversal level - (90 days MA) - 3.6913
Long- term trend remains to be bearish. ETH/EUR has closed slightly above 200 days MA yesterday. So a slight jump till 3.69/3.78 is possible.
Major resistance is seen at 3.47 (7 days EMA) and any break above targets 3.635 (21 days MA)/3.78 (100 day MA). Short-term support can be noticed at 3.34 (200 day MA) and any violation below will drag the pair till 2.90 (yesterday’s low) /2.76 (161.8% retracement of 3.04 and 4.145)/2.63.
Potential short-liquidation exposure was reported above $85,000 in the week leading up to Oct. 15. A separate cluster near $75,000 has no stated position direction.
Issuance will stay level for about 12 months, then taper to zero over 24 months. Five community-nominated council candidates require confirmation by veHNT holders.