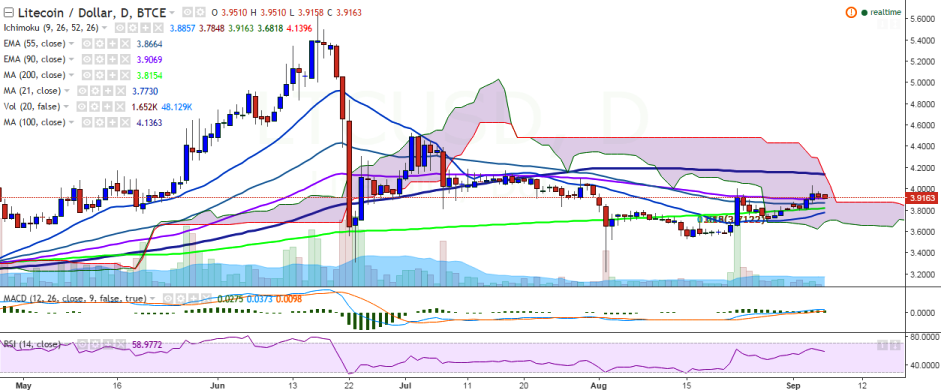
LTC/USD hovers around 90-EMA, break below targets 3.70
LTC/USD is trying to hold its strength above 90 EMA and is hovering around that level. It is currently trading at 3.91 levels at press time (BTC-e). Ichimoku analysis of daily chart: Tenkan Sen: 3.87 Kijun Sen: 3.78 Tren…
By Shampa Mani
Updated 1 min read
Image from the original EconoTimes article
LTC/USD is trying to hold its strength above 90 EMA and is hovering around that level. It is currently trading at 3.91 levels at press time (BTC-e).
Ichimoku analysis of daily chart:
Tenkan Sen: 3.87
Kijun Sen: 3.78
Trend reversal: 3.90 (90 EMA)
“LTC/USD has retreated after hitting 4.03 levels. A close below 90 EMA would further weakness in the pair and a decline till 3.70 is possible”, FxWirePro said in a statement.
Major resistance is seen at 4.03 levels (September 04 high) and a break above would see it testing 4.14 levels (100-day MA)/4.53 (July 02 high).
On the reverse side, the pair would find strong support at 3.81 (200-day MA) and a break below would drag the pair to 3.71 (August 28 low)/3.51 (161.8% retracement of 3.71 and 4.03).
The $1.000312 trillion market estimate is dated Sept. 30, 2025; a Senate proposal would direct revaluation proceeds toward Bitcoin purchases and public debt.