LTC/USD struggles to close below 200-day MA, further upside only above 4.00
LTC/USD is trying to hold its ground above 200-day MA and is trading at 3.82 levels at the time of writing (BTC-e). Ichimoku analysis of daily chart: Tenkan Sen: 3.78 Kijun Sen: 3.62 Trend reversal: 3.92 (90-day EMA) Maj…
By Shampa Mani
Updated 1 min read
Image from the original EconoTimes article
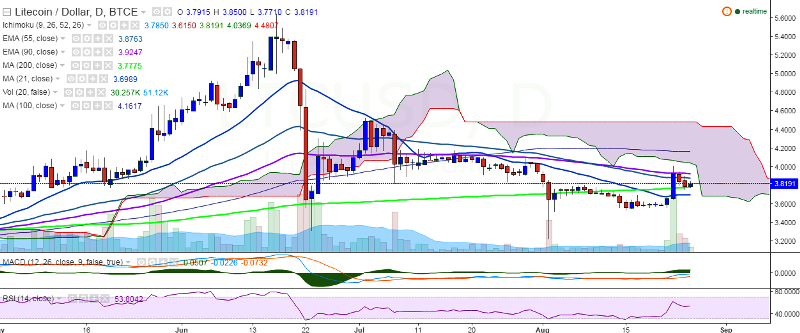
LTC/USD is trying to hold its ground above 200-day MA and is trading at 3.82 levels at the time of writing (BTC-e).
Ichimoku analysis of daily chart:
Tenkan Sen: 3.78
Kijun Sen: 3.62
Trend reversal: 3.92 (90-day EMA)
Major resistance is seen at 3.92 (90-day EMA) and a consistent break above would target 4.16 (100-day MA)/4.70 (113% retracement of 4.53 and 3.22).
On the reverse side, support is seen at 3.77 (200-day MA) and any violation will see the pair falling to 3.69 levels (21-day MA) and then 3.50/3.22 (August 02 low).