


 FxWirePro- Major Crypto levels and bias summary
  Ethereum Cracks Under $1,700: Sell the Rally Near $1,750 as Bears Eye $1,380–$1,200
  FxWirePro- Major Crypto levels and bias summary
  BTC’s Bear Bounce: Sell the Rally Near $66K as Bears Target $59K–$52K Breakdown
  FxWirePro- Major Crypto levels and bias summary


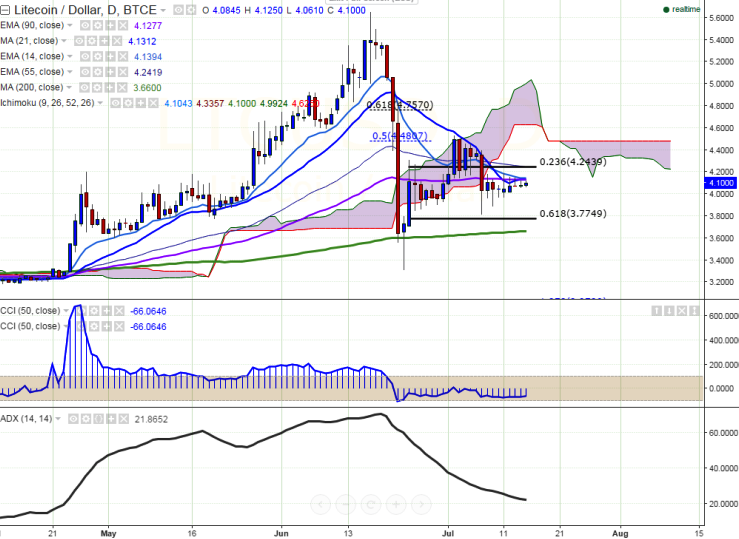
LTC/USD is trading in a narrow range between of $4.150 and 4.0570 for the past three trading session. It is currently trading around $4.10 (BTC-e).
Long-term trend -bullish
Short- term trend- bullish
Ichimoku analysis (Daily chart):
Tenkan-Sen $4.107
Kijun-Sen $4.345
Trend reversal - $4.1283
“In daily chart, the pair should break above $4.15 for further bullishness. Any break above $4.15 targets $4.40/$4.84 is possible”, FxWirePro said in a statement.
Major resistance is seen at $4.25 (55 day EMA) and any break above confirms major bullishness, a jump till $4.53 (Jul 2 high)$4.84 (22 Jun high)/$5. On the hand, the pair is likely to find support at $3.77 (61.8% retracement of $3.310 and $4.490) and a consistent break below will target $3.63 (200 day MA)/$3.31 (Jun 26 low).

- News

- Economy

- Central Banks
- Investing
- Research
- Roundups
- Digital Currency
- Insights
- Technical Analysis
- Technology
- Business
- Law
- Health
- Nature
- Fintech
- Science
- Topic
- Opinions
- ©Econometrics LLC . All Rights Reserved.
LTC/USD trades flat, break above $4.15 confirms further bullishness
Friday, July 15, 2016 12:39 PM UTC
Editor's Picks


- Market Data
Most Popular


