


 BTC’s Bear Bounce: Sell the Rally Near $66K as Bears Target $59K–$52K Breakdown
  FxWirePro- Major Crypto levels and bias summary


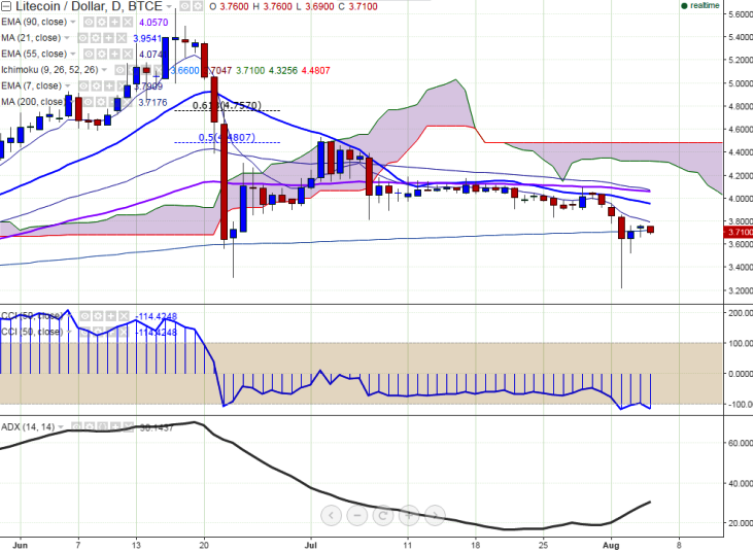
LTC/USD is trying to hold its strength above the 200-day MA on Friday. It fell below this major trend line briefly, hitting 3.69 levels, before restoring to 3.74 levels at the time of writing.
Ichimoku analysis of daily chart:
Tenkan Sen: 3.66
Kijun Sen: 3.70
Trend reversal: 3.71 (200 DMA)
The long-term trend remains weak for the pair. On the topside, the pair faces major resistance at 3.81 levels (7 EMA) and a break above would see the pair testing 4.06 levels (90 EMA)/4.53 (July 2 high). On the reverse side, support is likely to be found at 3.31 levels (June 23 low), and a break below would target 3.22 levels (August 2 low)/3.15 (113% retracement of 3.31 and 4.53).

- News

- Economy

- Central Banks
- Investing
- Research
- Roundups
- Digital Currency
- Insights
- Technical Analysis
- Technology
- Business
- Law
- Health
- Nature
- Fintech
- Science
- Topic
- Opinions
- ©Econometrics LLC . All Rights Reserved.
LTC/USD trades flat, close below 200-day MA confirms further weakness
Friday, August 5, 2016 11:28 AM UTC
Editor's Picks


- Market Data
Most Popular


