


 FxWirePro: USD/CAD retreats after Canada posts stronger-than-expected GDP growth
  US Magnificent 7 Stocks Trend Score: Amazon & Microsoft Hit Extreme Bullish (+100) as Meta Drops to -100 — Key Resistance & Support Watchlist
  AUDJPY Volatile After Massive Sell-Off: Sell Rallies at 113, Targeting 110 as Bearish Momentum Surges
  FxWirePro- Major Pair levels and bias summary
  FxWirePro: NZD/USD consolidates overnight gains, but loses momentum
  FxWirePro: GBP/USD rises as soft US data pressures dollar
  NZDJPY Bullish Rebound: Buy Dips as EMAs Align for 97 Target
  AUD/JPY Slips Below 112 as BOJ Intervention Sparks Bearish Momentum: Sell the Rallies
  FxWirePro: EUR/ AUD dips below 1.6400 level, focus on near term support
  US Magnificent 7 Stocks Trend Score: Amazon & Microsoft Hit Extreme Bullish (+100) as Meta Drops to -100 — Key Resistance & Support Watchlist
  NZDJPY Retreats on Yen Strength – Bearish Setup Targets 90 After Hitting 92.75 Low
  FxWirePro- Major Crypto levels and bias summary
  FxWirePro- Major Crypto levels and bias summary
  FxWirePro:USD/JPY climbs back above 160.00 after BOJ rate decision
  FxWirePro: GBP/AUD drifts lower after BOE rate decision
  FxWirePro: USD/CNY dips to hit three year low,scope for further downside


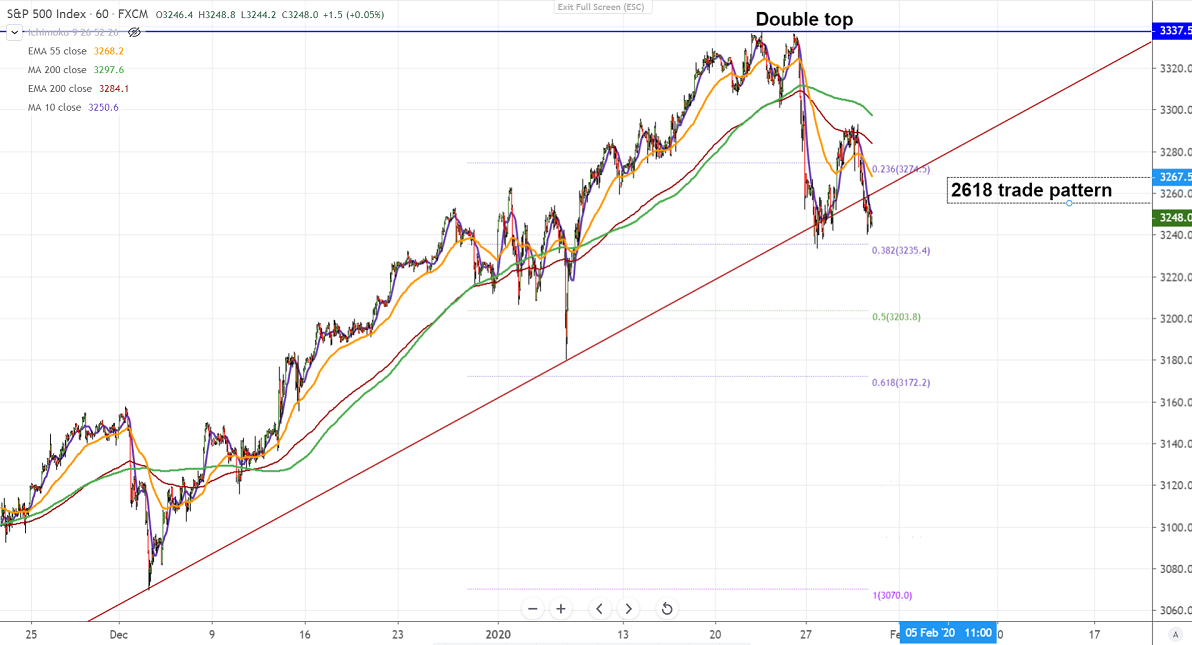
S&P500: 2618 trade pattern
Chart Pattern - Double top
S&P500 trades lower after a minor jump till 3293 and is currently trading around 3247. The spread of coronavirus is putting pressure on global stock markets. The death toll has increased to 170 and confirmed cases rose to 771, most of the death has been from Wuhan and province of Hubei.
On the flip side, immediate major resistance is around 3235 (38.2% fib) and any violation below will drag the index till 3203/3172.
The near-term resistance is around 3299 (200- 4H MA/61.8% fib), any indicative break above will take the index to next level till 3335/3350.
It is good to sell on rallies around 3265-70 with SL around 3300 for the TP of 3175.


