
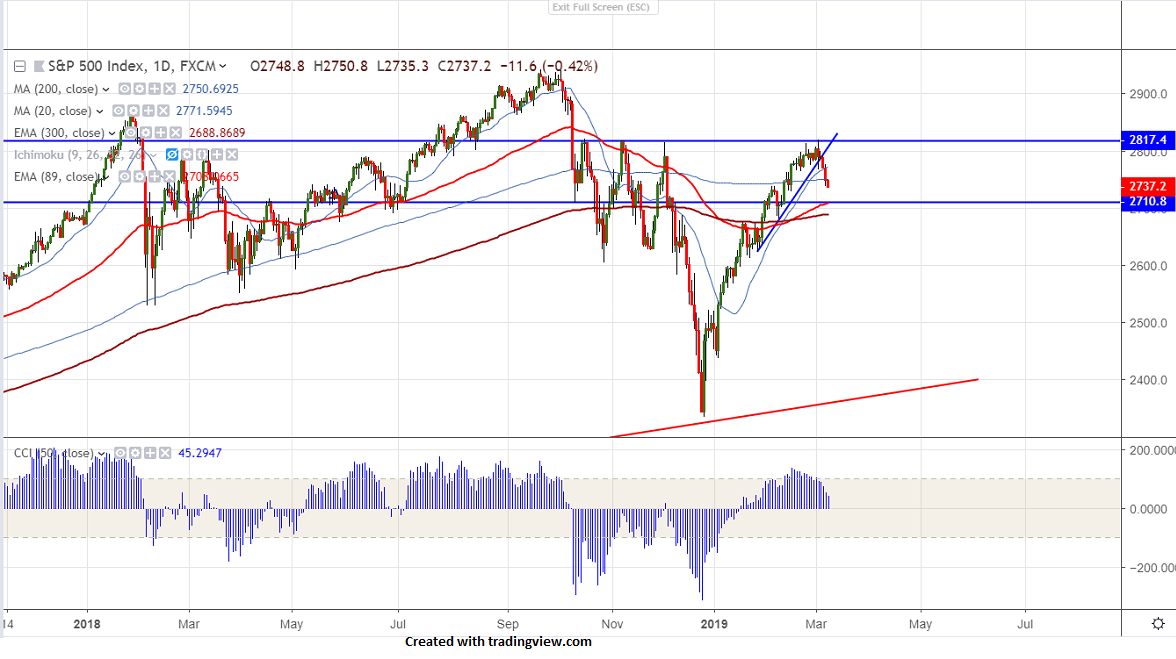
Chart pattern- Double top
Major resistance- 2820
S&P500 trades weak for 5th consecutive after a continuous jump for past more than 2- month. The index recovered more than 20% from low of 2334 level on account of easing trade tensions between US-China. It has lost more than 80 points from high and is trading slightly below 200- day MA.It hits low of 2735 and is currently trading around 2740.
The index is below near term major support 2748 (200- day MA) and any violation below will drag the index till 2728/2700. Any violation below 2680 confirms further weakness.
On the higher side, minor resistance is around 2770 and any break above will take the index to next level 2800/2820.It should break above 2820 for further bullishness.
It is good to sell on rallies around 2765-70 with SL around 2800 for the TP of 2680.


