


 FxWirePro- Major Crypto levels and bias summary
  FxWirePro- Major Crypto levels and bias summary
  FxWirePro- Major Crypto levels and bias summary
  BTC’s Bear Bounce: Sell the Rally Near $66K as Bears Target $59K–$52K Breakdown
  Ethereum Cracks Under $1,700: Sell the Rally Near $1,750 as Bears Eye $1,380–$1,200


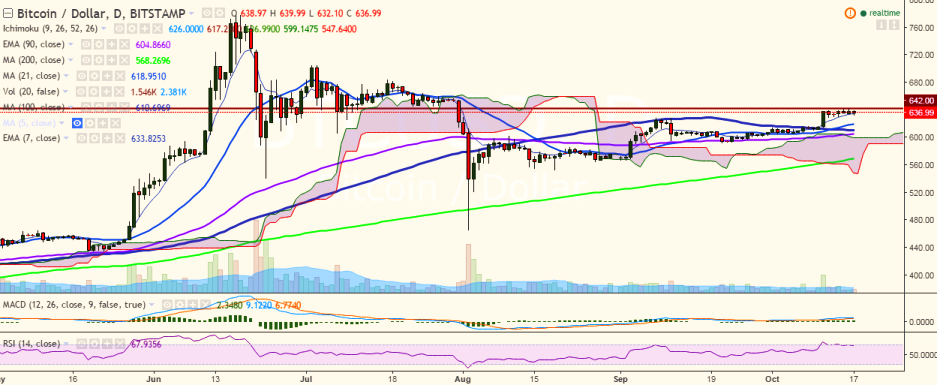
BTC/USD is struggling for a consistent break above 640 levels and is showing a small dip after hitting 642 levels on October 15th. It is currently trading at 636.99 levels at the time of writing (Bitstamp).
Long-term trend: Bullish
Short-term trend: Bullish
Ichimoku analysis of daily chart:
Tenkan Sen: 626
Kijun Sen: 617
Trend reversal: 604.14 (90 EMA)
“The pair is trading in the red on Monday and has hit a low of 632.10 levels so far in the day. Further bullishness would be seen only if it breaks above 642 levels”, FxWirePro said in a statement.
On the upside, major resistance is seen at 642 levels and a break above would see the pair testing 648.12 levels (161.8% retracement of 642 and 632.10)/684.19 (July 17 high).
On the downside, the pair is likely to find support near 627.89 (10-day MA) and a close below would bring slight bearishness in the pair, dragging it to 610.80 (100-day MA)/ 604.14 (90 EMA).

- News

- Economy

- Central Banks
- Investing
- Research
- Roundups
- Digital Currency
- Insights
- Technical Analysis
- Technology
- Business
- Law
- Health
- Nature
- Fintech
- Science
- Topic
- Opinions
- ©Econometrics LLC . All Rights Reserved.
BTC/USD faces strong resistance at 642, bullishness only above that level
Monday, October 17, 2016 7:26 AM UTC
Editor's Picks


- Market Data
Most Popular


