


 BTC’s Bear Bounce: Sell the Rally Near $66K as Bears Target $59K–$52K Breakdown
  Ethereum Cracks Under $1,700: Sell the Rally Near $1,750 as Bears Eye $1,380–$1,200
  FxWirePro- Major Crypto levels and bias summary
  FxWirePro- Major Crypto levels and bias summary


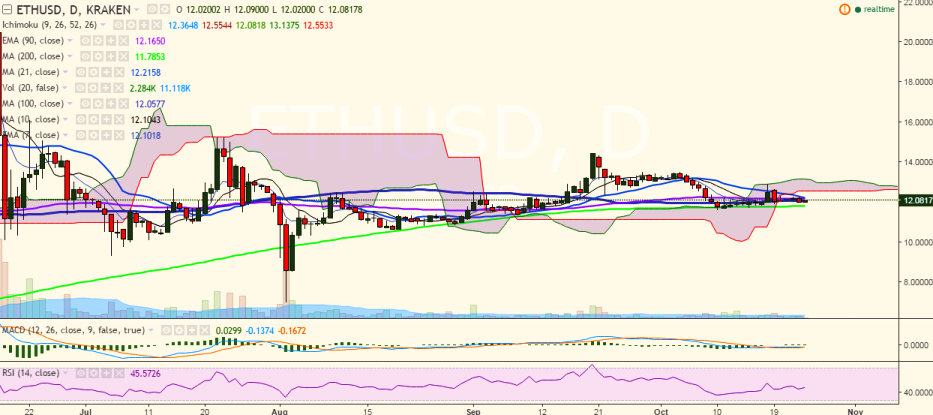
ETH/USD has taken support near 12.00 levels and is trying to hold its strength above this level. It currently trades at 12.08 levels (Kraken).
Ichimoku analysis of daily chart:
Tenkan Sen: 12.29
Kijun Sen: 12.55
Trend reversal: 12.16 (90 EMA)
The pair ran into resistance at 12.28 levels (21-day MA) on October 23 and failed to break above this level. It must close above 12.16 (90 EMA) for further upside and a consistent break above would see the pair testing 12.77 (61.8% retracement of 13.50 and 11.60)/12.89 (October 18 high). Bullishness in the pair could be confirmed only if it breaks above the previous high of 12.89 levels.
On the downside, the pair will find support near 12.00 levels and any violation would further weaken it to 11.77 (200-day MA)/11.60 (October 10 low).

- News

- Economy

- Central Banks
- Investing
- Research
- Roundups
- Digital Currency
- Insights
- Technical Analysis
- Technology
- Business
- Law
- Health
- Nature
- Fintech
- Science
- Topic
- Opinions
- ©Econometrics LLC . All Rights Reserved.
ETH/USD takes support near 12.00, bullishness only above 12.89
Monday, October 24, 2016 10:22 AM UTC
Editor's Picks


- Market Data
Most Popular


