


 Asian Currencies Steady as Dollar Holds Firm Ahead of Fed Decision and US-Iran Deal Details
  Global Motor Oil and Auto Paint Shortages Persist Despite Potential U.S.-Iran Peace Deal
  U.S.-Iran Peace Deal Extends Gulf Ceasefire, Reopens Strait of Hormuz
  Asian Stocks Advance as Nikkei Nears Record High Ahead of Fed Decision
  Dollar Slips as U.S.-Iran Peace Deal Optimism Boosts Risk Appetite Ahead of Fed Decision
  BOJ Raises Interest Rates to 1% as Inflation Pressures Persist
  Oil Prices Ease as Markets Weigh U.S.-Iran Peace Deal and Strait of Hormuz Reopening
  Japan Trade Deficit Narrows as Exports Surge in May
  Gold Prices Fall Amid Rate Jitters; Copper Steady as China Stimulus Eyed


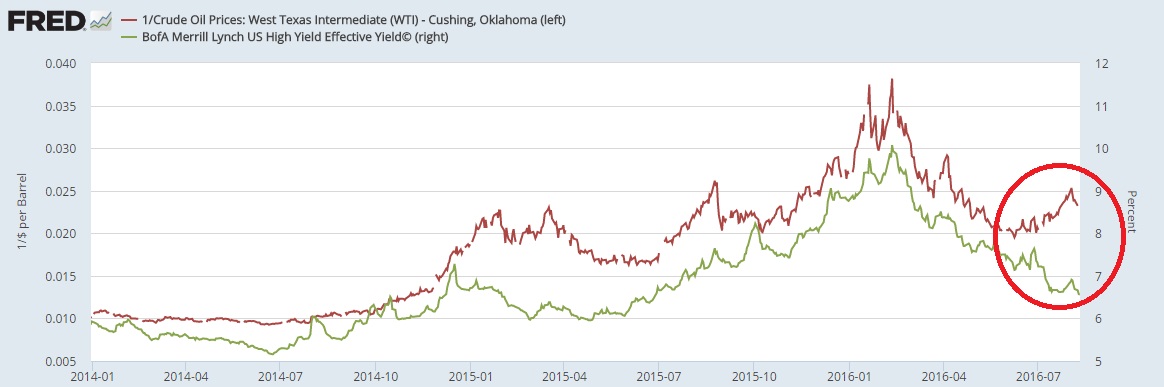
This chart made by us at FxWirePro, in St. Louis Fed's economic dashboard shows how the U.S. high yield bonds have gotten along with the crude oil price (inverse scale). How many barrels of crude a dollar buys vs. Effective yield calculated by Bank of America Merrill Lynch (BofAML).
Since 2015, they had have shown a very high level of intimacy, Crude went down, the yield went up. Both recovered since February.
However, recently these two, have diverged. the oil price edged lower but yields edged lower too. We wonder if the oil doesn't affect the financial position of the high yield companies anymore, the worst is over or is that the investors don't care? Just being crazy about the yield/return? And there will be no credit risk since the money printing is forever!!!


