


 World Cup technology: from ref cams to AI analysts, cutting-edge research is changing the game
  J.P. Morgan Sees Potential Vestas Guidance Upgrade Amid Strong Wind Energy Demand
  How AI prompting turned writerly description into an everyday skill
  Gold's 365-Day EMA Streak Since Oct 2023 Faces Its First Real Test at $3,980 — Break or Bounce to $4,140?
  Today’s space race could turn fatal if we don’t agree on new rules
  AI Memory Boom Sparks Global Chip Supply Crunch
  SpaceX Stock Gets $175 Target as Analysts See Massive Growth Ahead


 - EconoTimes)


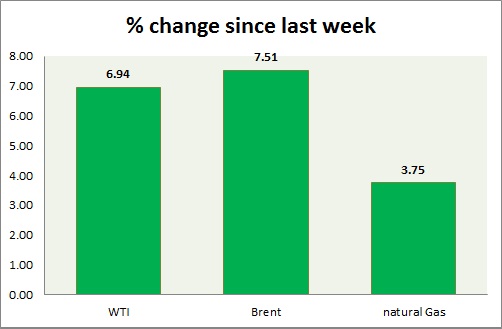
Energy segment gave up all most of the gains in today's trading. Weekly performance at a glance in chart & table -
- Oil (WTI) - WTI selloffs continued today after brief pause over FOMC and weak dollar. WTI traded as high as WTI is currently trading at $43.5/ barrel, down nearly 2.5% today. Immediate support lies at 42, 38 and resistance at 45.5, 48.3.
- Oil (Brent) - Brent performance is similar to WTI but mild better. Brent-WTI spread is trading at $ 11.36, support lies at $8 and resistance at $13. Brent has reached the initial target of $53. Might wail for further direction. Brent is trading at $54.83/barrel. Immediate support lies at 53, 50, 47 & resistance at 56, 58.4.
- Natural Gas - Natural gas is trading directionless. It broke above the initial resistance after FOMC but gave up the gain in today's trading. Today's inventory report failed to provide further direction. Inventory 45 billion cubic feet. Natural Gas is currently trading at 2.82/mmbtu. Immediate support lies at 2.65 & resistance at 2.87, 3.02.
|
WTI |
-3.18% |
|
Brent |
0.73% |
|
Natural Gas |
3.68% |


