


 Gold's 365-Day EMA Streak Since Oct 2023 Faces Its First Real Test at $3,980 — Break or Bounce to $4,140?
  How AI prompting turned writerly description into an everyday skill
  Goldman Sachs: US Dollar Likely to Stay Strong Despite Oil Price Retreat
  With Iran and the US signing a peace deal, where does that leave Benjamin Netanyahu?
  J.P. Morgan Sees Potential Vestas Guidance Upgrade Amid Strong Wind Energy Demand
  Today’s space race could turn fatal if we don’t agree on new rules
  AI Memory Boom Sparks Global Chip Supply Crunch
  Sell the Bounce": Gold Rally Stalls Near $4165 as Fed Hawks Slam the Door on Rate Cuts — Targets $4000/$3600
  Trump’s Iran Strategy: What Has Been Achieved After Three Months of Conflict?


 - EconoTimes)


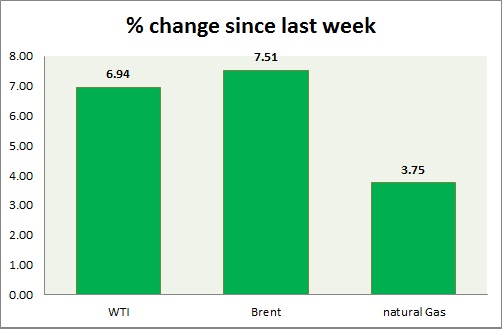
Energy segment lost grounds fast today, as supply concerns still remain at play. Weekly performance at a glance in chart & table
Oil (WTI) -
- WTI gave up gains after API data indicated inventory rise of 12.2 million barrels for the week, followed by EIA report of inventory increase by 10.95 million barrels.
- Price tested upper bound of the range around $54 yesterday. Bulls might be in trouble as price seem to be forming bearish engulfing candle in daily chart near top of the range.
- WTI is currently trading at $51.6/barrel, down 4.3% today. Immediate support lies at $49.8-49.5, $47.5-47 and resistance at $54-54.5, and $58.7-59.2.
Oil (Brent) -
- Brent is doing better than WTI intraday, however failed to gain much ground in spreads, after yesterday's big loss. Shell's bid for BG might have played some in the speculative rise.
- Brent-WTI spread still looks weak, trading at $ 5.3/barrel. Further shrinkage can't be ruled out.
- Brent is trading at $56.9/barrel. Downtrend remains intact. Immediate support lies at $54.5-53 area and resistance at $ 59.4-60.2 region.
Natural Gas -
- Natural gas price is moving towards lower support region. Price as of now breaking to new low. $2.66 area is providing resistance.
- Price pattern suggests that prices might drop down towards $2.44/mmbtu. Concern over higher inventory rise this week is weighing on price.
- Natural Gas is currently trading at 2.61/mmbtu, down 2% today. Immediate support lies at 2.55 & resistance at 2.74, 2.81
|
WTI |
+4.26% |
|
Brent |
+3.06% |
|
Natural Gas |
-3.19% |


