


 J.P. Morgan Sees Potential Vestas Guidance Upgrade Amid Strong Wind Energy Demand
  Today’s space race could turn fatal if we don’t agree on new rules
  Silver Cracks Key 365-Day EMA for First Time Since Feb 2024; Bears Eye $50 on Rallies
  How AI prompting turned writerly description into an everyday skill
  World Cup technology: from ref cams to AI analysts, cutting-edge research is changing the game
  How Donald Trump has changed the way diplomacy is done
  AI Memory Boom Sparks Global Chip Supply Crunch


 - EconoTimes)


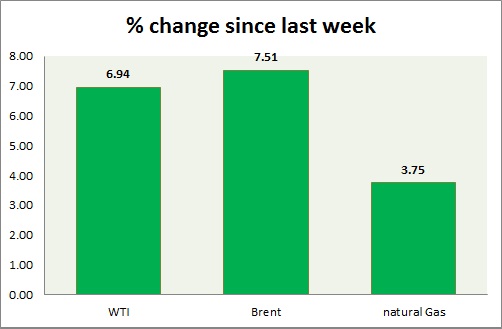
Energy segment's performance is mixed today, oils are up while gas is down. Weekly performance at a glance in chart & table
Oil (WTI) -
- WTI is facing selling pressure since yesterday, as crude inventory continue to rise in US at record breaking pace.
- Bulls are lacking force after price failed to break sellers around $54. Price might drop lower o test the resolve of the buyers.
- WTI is currently trading at $50.76/barrel, up 0.7% today. Immediate support lies at $49.8-49.5, $47.5-47 and resistance at $54-54.5, and $58.7-59.2.
Oil (Brent) -
- Brent price remain under pressures as reports show supply remains at large from OPEC and Africa.
- Brent-WTI spread has gained ground after US stockpile report, trading at $ 6/barrel. Short trades are advised to book profits. Spread might widen once more.
- Brent is trading at $56.7/barrel. Downtrend still in play. Immediate support lies at $54.5-53 area and resistance at $ 59.4-60.2 region.
Natural Gas -
- Natural gas price dropped sharply this week, now testing the lower bound of the range. Further selloff can't be ruled out, however buy orders are expected to be large around current price at $2.54/mmbtu.
- Price pattern suggests that prices might drop down towards $2.44/mmbtu. According to EIA report published inventory increased by 15 billion cubic feet. Weaker intake over summer might push price lower towards $2.2/mmbtu.
- Natural Gas is currently trading at 2.55/mmbtu, down 2.7% today. Immediate support lies at 2.55 area & resistance at $2.71, 2.81. $2.50 might provide psychological resistance.
|
WTI |
+2.44% |
|
Brent |
+2.70% |
|
Natural Gas |
-5.42% |


