


 J.P. Morgan Sees Potential Vestas Guidance Upgrade Amid Strong Wind Energy Demand
  Silver Cracks Key 365-Day EMA for First Time Since Feb 2024; Bears Eye $50 on Rallies
  With Iran and the US signing a peace deal, where does that leave Benjamin Netanyahu?
  China’s AI Manufacturing Boom Masks Weak Consumer Economy, Citi Says
  How AI prompting turned writerly description into an everyday skill
  How Donald Trump has changed the way diplomacy is done
  Gold's 365-Day EMA Streak Since Oct 2023 Faces Its First Real Test at $3,980 — Break or Bounce to $4,140?


 - EconoTimes)


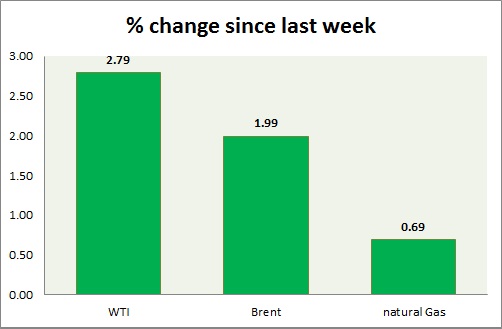
Energy segment is recovering after losing ground yesterday in New York trading. Weekly performance at a glance in chart & table.
Oil (WTI) -
- WTI is facing selling pressure after gaining close $62.6/barrel yesterday, as crude stock pile US fell by 3.9 million barrels. Crude came very close to second target of $63-$65 area. Next target is coming around $70/barrel.
- However price might drop in short term. Very bearish Grave stone doji appeared in daily candle. Some profit booking is suggested.
- WTI is currently trading at $60.8/barrel. Immediate support lies at $55-54.6, $51.2-50 and resistance at $63-$65. $58 area might provide interim support.
Oil (Brent) -
- Brent like WTI looking weaker in short term. Bearish inverted hammer appeared in daily chart.
- Brent-WTI spread dropped 20 cents today, currently trading at $7/barrel.
- Brent is trading at $67.8/barrel. Immediate support lies at $63.7-63.2, 61.8-61.4 area and resistance at $ 70 region. Traders should book partial profit as it might go down near term.
Natural Gas -
- Natural gas is consolidating close to resistance area. Risk reward remains favorable to the short side. Focus is on today EIA inventory report and tomorrow's non-farm payroll report.
- Bulls need to break above $2.85-$2.9 area to diminish downside bias significantly.
- Natural Gas is currently trading at 2.79/mmbtu. Immediate support lies at $2.72, $2.44 area & resistance at $2.86.
|
WTI |
+2.79% |
|
Brent |
+1.99% |
|
Natural Gas |
+0.69% |


