


 Gold's 365-Day EMA Streak Since Oct 2023 Faces Its First Real Test at $3,980 — Break or Bounce to $4,140?
  How AI prompting turned writerly description into an everyday skill
  AI Memory Boom Sparks Global Chip Supply Crunch
  With Iran and the US signing a peace deal, where does that leave Benjamin Netanyahu?
  Today’s space race could turn fatal if we don’t agree on new rules
  SpaceX Stock Gets $175 Target as Analysts See Massive Growth Ahead
  Trump’s Iran Strategy: What Has Been Achieved After Three Months of Conflict?
  Silver Cracks Key 365-Day EMA for First Time Since Feb 2024; Bears Eye $50 on Rallies


 - EconoTimes)


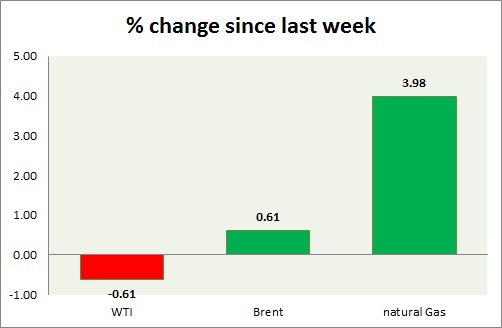
Energy segment is mixed gas advancing while oil lags. Weekly performance at a glance in chart & table.
Oil (WTI) -
- WTI dropped further today, as dollar gained back footing however gained back from $58.4 after dollar dropped post disappointing data.
- WTI carved bearish doji in weekly chart and very bearish grave stone doji in daily chart. Further downside remains open if doji high is not taken out. RSI is also around 50 level resistance.
- WTI is currently trading at $59/barrel. Immediate support lies at $55-54.6, $51.2-50 and resistance at $63-$65. $58 may continue to provide interim support.
Oil (Brent) -
- Brent is a better performer than WTI so far this week so far, however WTI is doing better today.
- Brent-WTI spread lost around 40 cents, currently trading at $6.8/barrel. Further rise seems likely in favor of Brent. Partial profit booking is suggested at this level.
- Brent is trading at $65.8/barrel. Immediate support lies at $63.7-63.2, 61.8-61.4 area and resistance at $ 70 region.
Natural Gas -
- Natural gas gained further ground after breaking $3 level. Further rise is likely, however price might go for consolidation around $3 before advancing further.
- Price target for bulls are coming close to $3.5/mmbtu, should support at $2.45 holds. Averaging it as low as possible would diminish risk.
- Natural Gas is currently trading at $2.98/mmbtu. Immediate support lies at $2.72, $2.65, $2.44 area & resistance at $3.06.
|
WTI |
-0.61% |
|
Brent |
+0.61% |
|
Natural Gas |
+3.98% |


