


 How AI prompting turned writerly description into an everyday skill
  SpaceX Stock Gets $175 Target as Analysts See Massive Growth Ahead
  Silver Cracks Key 365-Day EMA for First Time Since Feb 2024; Bears Eye $50 on Rallies
  Sell the Bounce": Gold Rally Stalls Near $4165 as Fed Hawks Slam the Door on Rate Cuts — Targets $4000/$3600
  AI Memory Boom Sparks Global Chip Supply Crunch
  Trump’s Iran Strategy: What Has Been Achieved After Three Months of Conflict?
  Today’s space race could turn fatal if we don’t agree on new rules
  Gold's 365-Day EMA Streak Since Oct 2023 Faces Its First Real Test at $3,980 — Break or Bounce to $4,140?
  J.P. Morgan Sees Potential Vestas Guidance Upgrade Amid Strong Wind Energy Demand
  World Cup technology: from ref cams to AI analysts, cutting-edge research is changing the game


 - EconoTimes)


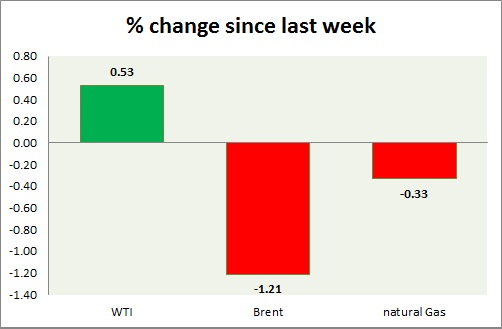
Energy segment advanced today, however giving up gains fast. Weekly performance at a glance in chart & table.
Oil (WTI) -
- WTI gained today in early Asian session as Middle East tension resumed and dollar weakened. However giving up gains after making high at $61.7 area.
- WTI carved bearish doji in weekly chart and very bearish grave stone doji in daily chart. Further downside remains open if doji high is not taken out. RSI is also around 50 level resistance.
- WTI is currently trading at $60.3/barrel. Immediate support lies at $55-54.6, $51.2-50 and resistance at $63-$65. $58 may continue to provide interim support.
Oil (Brent) -
- Brent is losing grounds faster than WTI, after carving high at $67.91
- Brent-WTI spread lost around 90 cents, currently trading at $5.9/barrel.
- Brent is trading at $66.08/barrel. Immediate support lies at $63.7-63.2, 61.8-61.4 area and resistance at $ 70 region.
Natural Gas -
- Natural gas is consolidating around $3 area, however further rise remain in card.
- Price target for bulls are coming close to $3.5/mmbtu, should support at $2.45 holds. Averaging it as low as possible would diminish risk.
- Natural Gas is currently trading at $3/mmbtu. Immediate support lies at $2.72 area & resistance at $3.06.
|
WTI |
+0.53% |
|
Brent |
-1.21% |
|
Natural Gas |
-0.33% |


