


 AI Memory Boom Sparks Global Chip Supply Crunch
  Silver Cracks Key 365-Day EMA for First Time Since Feb 2024; Bears Eye $50 on Rallies
  Gold's 365-Day EMA Streak Since Oct 2023 Faces Its First Real Test at $3,980 — Break or Bounce to $4,140?
  Goldman Sachs: US Dollar Likely to Stay Strong Despite Oil Price Retreat
  SpaceX Stock Gets $175 Target as Analysts See Massive Growth Ahead
  Today’s space race could turn fatal if we don’t agree on new rules
  J.P. Morgan Sees Potential Vestas Guidance Upgrade Amid Strong Wind Energy Demand
  How Donald Trump has changed the way diplomacy is done
  China’s AI Manufacturing Boom Masks Weak Consumer Economy, Citi Says
  With Iran and the US signing a peace deal, where does that leave Benjamin Netanyahu?


 - EconoTimes)


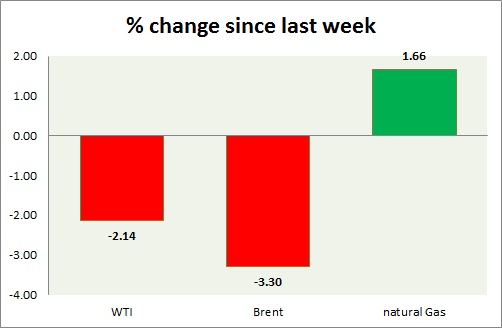
Oil gave up and gas gained. Weekly performance at a glance in chart & table.
Oil (WTI) -
- WTI gave up further gains amid stronger Dollar. Middle East tension is failing to create much upside momentum.
- WTI carved bearish doji in weekly chart and very bearish grave stone doji in daily chart. Further downside remains open if doji high is not taken out. RSI is also around 50 level resistance.
- WTI is currently trading at $58.6/barrel. Immediate support lies at $55-54.6, $51.2-50 and resistance at $63-$65. $58 may continue to provide interim support.
Oil (Brent) -
- Brent is slightly better performer today than WTI, however going down in line
- Brent-WTI spread gained around 20 cents, currently trading at $6.1/barrel.
- Brent is trading at $64.7/barrel. Immediate support lies at $63.7-63.2, 61.8-61.4 area and resistance at $ 70 region.
Natural Gas -
- Natural gas gained further ground as demand remains high. Traded as high as 3.11/mmbtu
- Price target for bulls are coming close to $3.5/mmbtu, should support at $2.45 holds. Averaging it as low as possible would diminish risk.
- Natural Gas is currently trading at $3.06/mmbtu. Immediate support lies at $2.78 area & resistance at $3.32.
|
WTI |
-2.14% |
|
Brent |
-3.30% |
|
Natural Gas |
+1.66% |


