


 How Donald Trump has changed the way diplomacy is done
  Gold Surges Above Key EMAs, Bulls Eye Resistance Amidst Bullish Momentum
  SpaceX Stock Gets $175 Target as Analysts See Massive Growth Ahead
  Silver Cracks Key 365-Day EMA for First Time Since Feb 2024; Bears Eye $50 on Rallies
  Bank Regulation Rollbacks in the U.S. and UK Could Increase Financial Risks, Study Warns
  Sell the Bounce": Gold Rally Stalls Near $4165 as Fed Hawks Slam the Door on Rate Cuts — Targets $4000/$3600
  Morgan Stanley Sees Chinese Auto Market Recovery Gaining Momentum in Late Summer
  With Iran and the US signing a peace deal, where does that leave Benjamin Netanyahu?
  Today’s space race could turn fatal if we don’t agree on new rules
  World Cup technology: from ref cams to AI analysts, cutting-edge research is changing the game


 - EconoTimes)


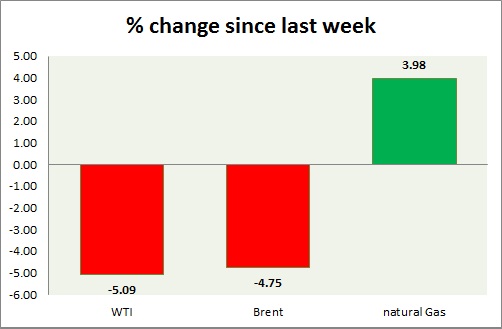
Energy pack is mixed, while oil is down, gas is up. Weekly performance at a glance in chart & table.
Oil (WTI) -
- WTI dropped further today as $45 support was taken out yesterday. Today's range $45.3-44.2
- WTI is likely to fall towards $42 area. The drop might extend below $40 area.
- WTI is currently trading at $44.4/barrel. Immediate support lies at $42 and resistance at $54
Oil (Brent) -
- Brent is a better performer than WTI. Today's range - $48.9-49.9.
- Brent-WTI spread rose by 70 cents since last trading day, currently trading at $4.9/barrel.
- $50 area is posing as resistance.
- Brent is trading at $49.3/barrel. Immediate support lies at $45 area and resistance at $53 region.
Natural Gas -
- Natural trading in positive after finding support around $2.7 area once more. Today's range $2.84-2.72.
- Price might reach as low as $2.35 if it clears $2.7 mark, whereas bulls might try to test $2.95 area.
- Focus is on FOMC on tomorrow.
- Inventory rose by 32 billion cubic feet this week.
- Natural Gas is currently trading at $2.82/mmbtu. Immediate support lies at $2.55, $2.45 area & resistance at $2.95, $3.04, $3.32.
|
WTI |
-5.09% |
|
Brent |
-4.75% |
|
Natural Gas |
+3.98% |


