


 Goldman Sachs: US Dollar Likely to Stay Strong Despite Oil Price Retreat
  J.P. Morgan Sees Potential Vestas Guidance Upgrade Amid Strong Wind Energy Demand
  Sell the Bounce": Gold Rally Stalls Near $4165 as Fed Hawks Slam the Door on Rate Cuts — Targets $4000/$3600
  How Donald Trump has changed the way diplomacy is done
  How AI prompting turned writerly description into an everyday skill
  With Iran and the US signing a peace deal, where does that leave Benjamin Netanyahu?
  World Cup technology: from ref cams to AI analysts, cutting-edge research is changing the game
  AI Memory Boom Sparks Global Chip Supply Crunch


 - EconoTimes)


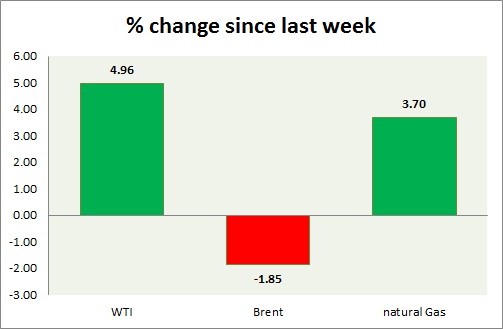
Energy segment performance is mixed over this week with more whipsaw movement. Performance this week at a glance in chart & table -
- Oil (WTI) - WTI, the best performer this week, continues to feel the pressure above $50 as US continue to produce crude above 9 million barrels/ day and refineries are operating near 86% capacity. Stock continued to build up reducing the storage capacity further to multi decade levels. WTI is currently trading at $51.6/ barrel, up 0.20% for the day. Recent price trends suggest further gains could be ahead. Immediate support lies at 48 and resistance at 54.
- Oil (Brent) - Brent continues to be the worst performer this week as cracks continues to exist between both the OPEC and non-OPEC producers. It gave up further gains against the WTI. Brent-WTI spread narrowed further and trading just above $9 down from $13 on Monday. Brent is trading at $60.9/barrel, up 0.74%. Immediate support lies at 58 & resistance at 63.
- Natural Gas - Natural gas has gained further taking support near the 2.65 level and today's inventory report showed greater reduction at 228 billion cubic feet compared to previous 219 billion cubic feet. Natural gas is currently trading at $ 2.80/mmbtu after failed attempt to decisively break the level. Immediate support lies at 2.65 & resistance at 2.83.
|
WTI |
4.96% |
|
Brent |
-1.85% |
|
Natural Gas |
3.70% |


