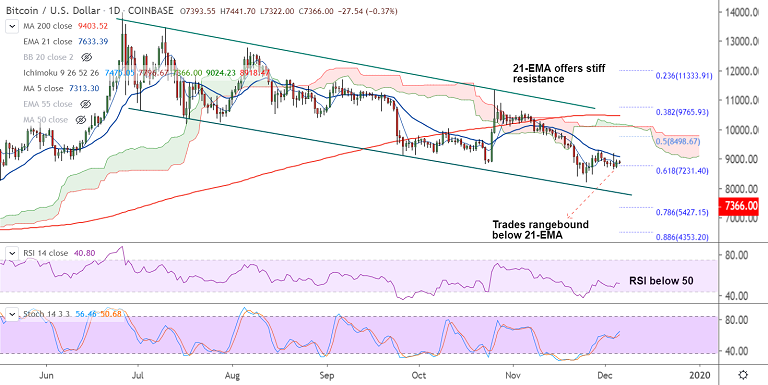
BTC/USD chart - Trading View
Exchange - Coinbase
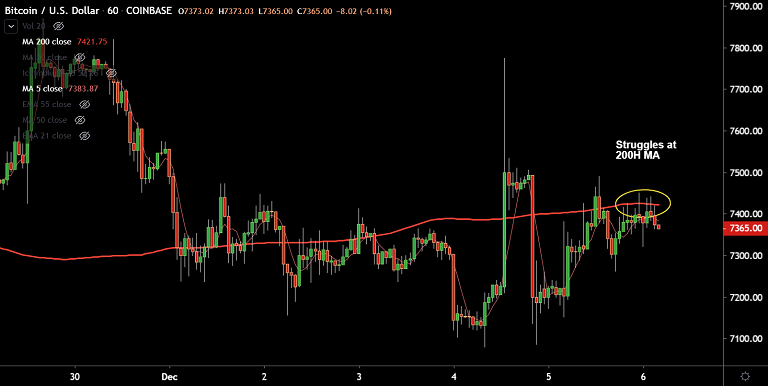
Support: 7231 (61.8% Fib); Resistance: 7421 (200H MA)
Technical Analysis: Bias Bearish
BTC/USD has been trading rangebound in the Asian session, intraday bias remains neutral.
The pair was trading largely muted at 7364 at 04:15 GMT, after closing 2.70% higher in the previous session.
Major trend in the pair is bearish as shown by the GMMA indicator. Recovery attempts were capped at 21-EMA resistance (currently at 7632).
Technical indicators on the intraday charts are neutral to slightly bullish. Pair is holding above 5-DMA support (7312).
However, 200-DMA is stiff resistance at 7421. Price action is struggling to break above. Test of 21-EMA likely on successful breakout.
Major trend in the pair is bearish, Break above 21-EMA could see shift in near-term dynamics.

ETH Cracks $2,100 in Bitcoin’s Wake as Bearish EMA Stack Deepens; Sellers Target $1,900 on Rallies
FxWirePro: USD/ZAR slips as SARB delivers surprise rate hike
Ethereum Tumbles Below $2K: Bears Eye $1,700 as All Key EMAs Flip Red
Bitcoin Cracks $75K as $1.3B ETF Exodus and Middle East Jitters Spook Bulls; Bears Eye $70K
FxWirePro- Major Crypto levels and bias summary
FxWirePro: GBP/NZD extends decline , vulnerable to more downside
Pound-Yen Roars Back Above 214: Bulls Reload for 216–217 Charge on Dip-Buying Setup
Ether Breaks Below $2,100: Triple EMA “Sell-the-Rally” Setup Targets $1,900
NZD/JPY Breakout Blast: Kiwi Rocket Smashes 94.50 Resistance, Bulls Lock Sights on 95
FxWirePro- Major Pair levels and bias summary
FxWirePro: GBP/AUD downside pressure builds, key support level in focus
FxWirePro: GBP/NZD slide extends ,eyes 2.2600 level