


 AUDJPY Extremely Bullish Above 113: Strong AUD Fuels Fresh Rally – Buy Dips at 113 Targeting 115
  FxWirePro- Major Crypto levels and bias summary
  FxWirePro- Woodies pivot (Major)
  FxWirePro: NZD/USD trades in narrow range ,outlook bullish
  GBPUSD, AUDUSD & NZDUSD Turn Extremely Bullish: Strong Positive Momentum Drives Major Pair Action Bias
  ETH Stands Alone Bullish; BTC, SOL, XRP, BNB Neutral
  FxWirePro: USD/JPY uptrend loses steam, remains on bullish path
  FxWirePro: EUR/AUD outlook weaker on renewed downside pressure


, 'Shooting Star' on weekly charts to plummet prices further - EconoTimes)


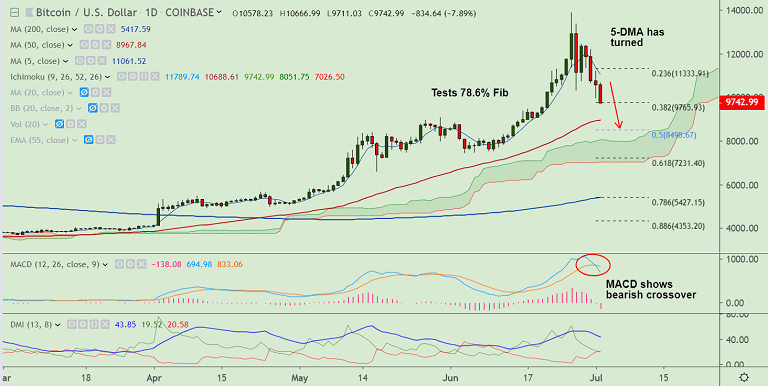
BTC/USD chart - Trading View
Exchange - Coinbase
Support: 8872 (55-EMA); Resistance: 10298 (21-EMA)
Technical Analysis: Bias Bearish
BTC/USD extends weakness below $10,000 mark, hits new 2-week lows at 9733.
Technical indicators support weakness. Stochs and RSI are sharply lower.
MACD is now showing a bearish crossover on signal line. GMMA indicators shows shift in trend towards downside on the intraday charts.
'Bearish divergence' on the daily charts and a confirmed 'Death Cross' on the hourlies adds to the bearish bias.
Further, 'Shooting Star' pattern form on the previous week's candle is likely to drag prices lower.
The pair has broken below 38.2% Fib and is on track to test 55-EMA at 8872.
For details on FxWirePro's Currency Strength Index, visit http://www.fxwirepro.com/currencyindex.


