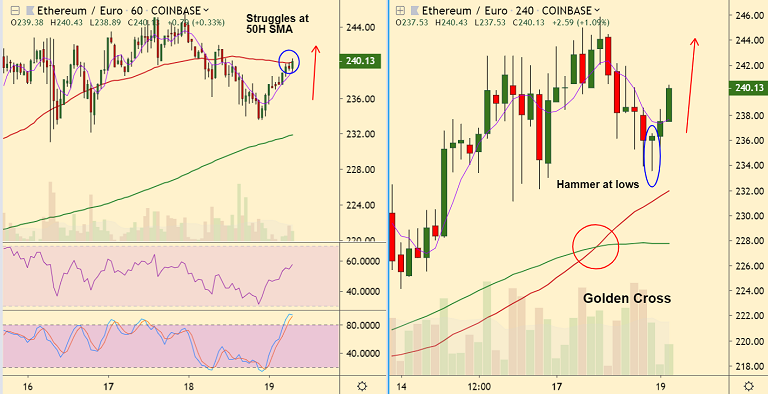
ETH/EUR chart - Trading View
Exchange - Coinbase
Support: 228 (converged 20-DMA and 21-EMA) ; Resistance: 250 (Upper BB)
Technical Analysis: Bias Bullish
ETH/EUR pares most of previous session's losses, trades 1.63% higher at 240.17 at 07:30 GMT.
The pair has retraced from session lows with a hammer formation on the 4H charts. 'Golden Cross' adds to the bullish bias.
Price action is currently struggling at 50H SMA at 240, breakout there could propel the pair higher.
Major trend in the pair is bullish. GMMA indicator shows near and long term bullishness for the pair.
Correction failed to break below 200H SMA and bullish 5-DMA crossover on 20-DMA to see bullish resumption.
Upper Bollinger band at 250 could offer minor resistance before bulls retake 2019 highs at 260.
Strong support seen at 228 (converged 20-DMA and 21-EMA). Break below could see further weakness.
For details on FxWirePro's Currency Strength Index, visit http://www.fxwirepro.com/currencyindex.